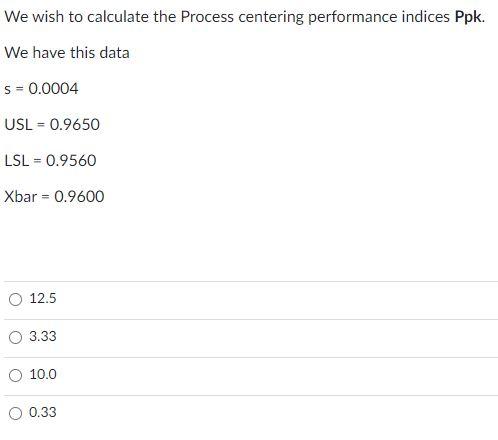
Question: We wish to calculate the Process centering performance indices Ppk. We have this data s = 0.0004 USL = 0.9650 LSL = 0.9560 Xbar =

We wish to calculate the Process centering

We wish to calculate the Process centering

We wish to calculate the Process centering performance indices Ppk. We have this data s = 0.0004 USL = 0.9650 LSL = 0.9560 Xbar = 0.9600 12.5 3.33 10.0 O 0.33 Factors for Computing Central Lines and 30 Control Limits for X s, and R Charts Observations in Sample, n , n Chart for Averages Chart for Ranges Chart for Standard Deviations Factors for Control Limits Factor for Central Line Factors for Control Limits Factor for Central Line Factors for Control Limits A Az Az dz di D D2 D DA C4 B3 B B: B6 2 2.121 1.880 2.659 1.128 0.853 0 3.686 0 3.267 0.7979 0 3.267 0 2.606 3 1.732 1.023 1.954 1.693 0.888 0 4.358 0 2.574 0.8862 0 2.568 0 2.276 4 1.500 0.729 1.628 2.059 0.880 0 4.698 0 2.282 0.9213 0 2.266 0 2.088 5 1.342 0.577 1.427 2.326 0.864 0 0 4.918 0 2.114 0.9400 0 2.089 0 1.964 6 1.225 0.483 1.287 2.534 0.848 0 5.078 0 0 2.004 0.9515 0.030 1.970 0.029 1.874 7 1.134 0.419 1.182 2.704 0.833 0.204 5.204 0.076 1.924 0.9594 0.118 1.882 0.113 1.806 8 1.061 0.373 1.099 2.847 0.820 0.388 5.306 0.136 1.864 0.9650 0.185 1.815 0.179 1.751 9 1.000 0.337 1.032 2.970 0.808 0.547 5.393 0.184 1.816 0.9693 0.239 1.761 0.232 1.707 10 0.949 0.308 0.975 3.078 0.797 0.687 5.469 0.223 1.777 0.9727 0.284 1.716 0.276 1.669 11 0.905 0.285 0.927 3.173 0.787 0.811 5.535 0.256 1.744 0.9754 0.321 1.679 0.313 1.637 12 0.866 0.266 0.886 3.258 0.778 0.922 5.594 0.283 1.717 0.9776 0.354 1.646 0.346 1.610 13 0.832 0.249 0.850 3.336 0.770 1.025 5.647 0.307 1.693 0.9794 0.382 1.618 0.374 1.585 14 0.802 0.235 0.817 3.407 0.763 1.118 5.696 0.328 1.672 0.9810 0.406 1.594 0.399 1.563 15 0.775 0.223 0.789 3.472 0.756 1.203 5.741 0.347 1.653 0.9823 0.428 1.572 0.421 1.544 16 0.750 0.212 0.763 3.532 0.750 1.282 5.782 0.363 1.637 0.9835 0.448 1.552 0.440 1.526 17 0.728 0.203 0.739 3.588 0.744 1.356 5.820 0.378 1.622 0.9845 0.466 1.534 0.458 1.511 18 0.707 0.194 0.718 3.640 0.739 1.424 5.856 0.391 1.608 0.9854 0.482 1.518 0.475 1.496 19 0.688 0.187 0.698 3.689 0.734 1.487 5.891 0.403 1.597 0.9862 0.497 1.503 0.490 1.483 20 0.671 0.180 0.680 3.735 0.729 1.549 5.921 0.415 1.585 0.9869 0.510 1.490 0.504 1.470

Step by Step Solution

There are 3 Steps involved in it

1 Expert Approved Answer
Step: 1 Unlock blur-text-image
Question Has Been Solved by an Expert!

Get step-by-step solutions from verified subject matter experts

Step: 2 Unlock
Step: 3 Unlock

Students Have Also Explored These Related General Management Questions!