

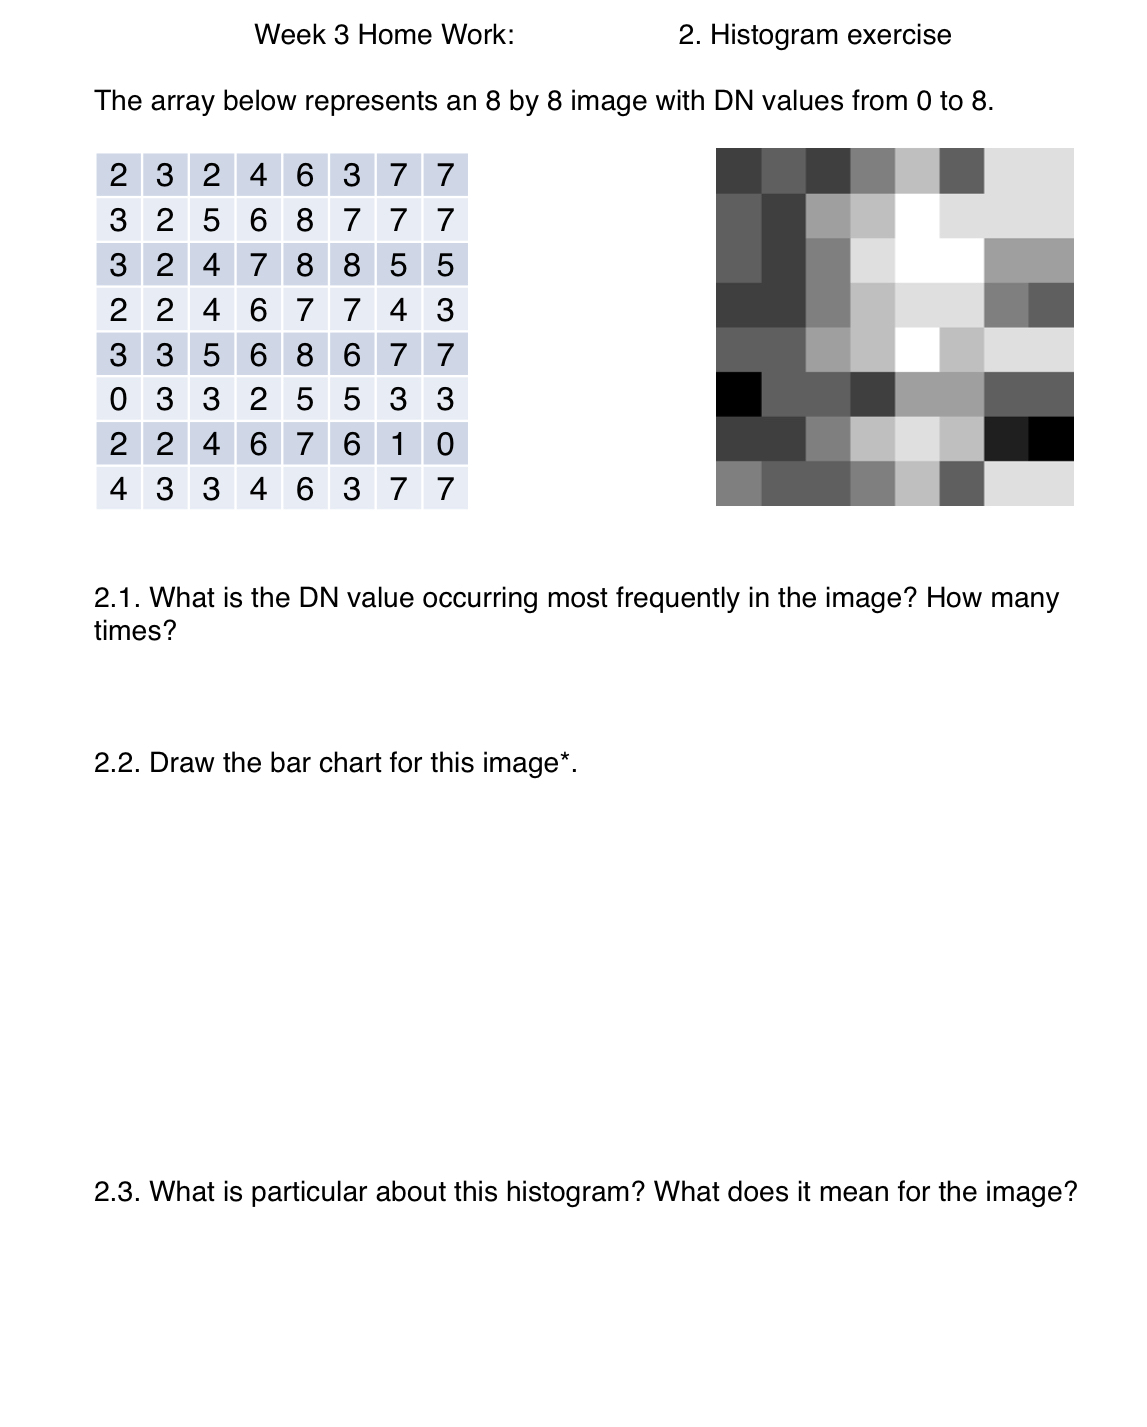
Question: Week 3 Home Work: 2 . Histogram exercise The array below represents an 8 by 8 image with DN values from 0 to 8 .
Week Home Work:
Histogram exercise
The array below represents an by image with DN values from to
What is the DN value occurring most frequently in the image? How many times?
Draw the bar chart for this image
What is particular about this histogram? What does it mean for the image?
Step by Step Solution
There are 3 Steps involved in it
1 Expert Approved Answer
Step: 1 Unlock

Question Has Been Solved by an Expert!
Get step-by-step solutions from verified subject matter experts
Step: 2 Unlock
Step: 3 Unlock