

Question: Week 5 Lab Assignment Name: Instructor Name: Please use this template to help answer the questions listed in the lab instructions. The steps below refer
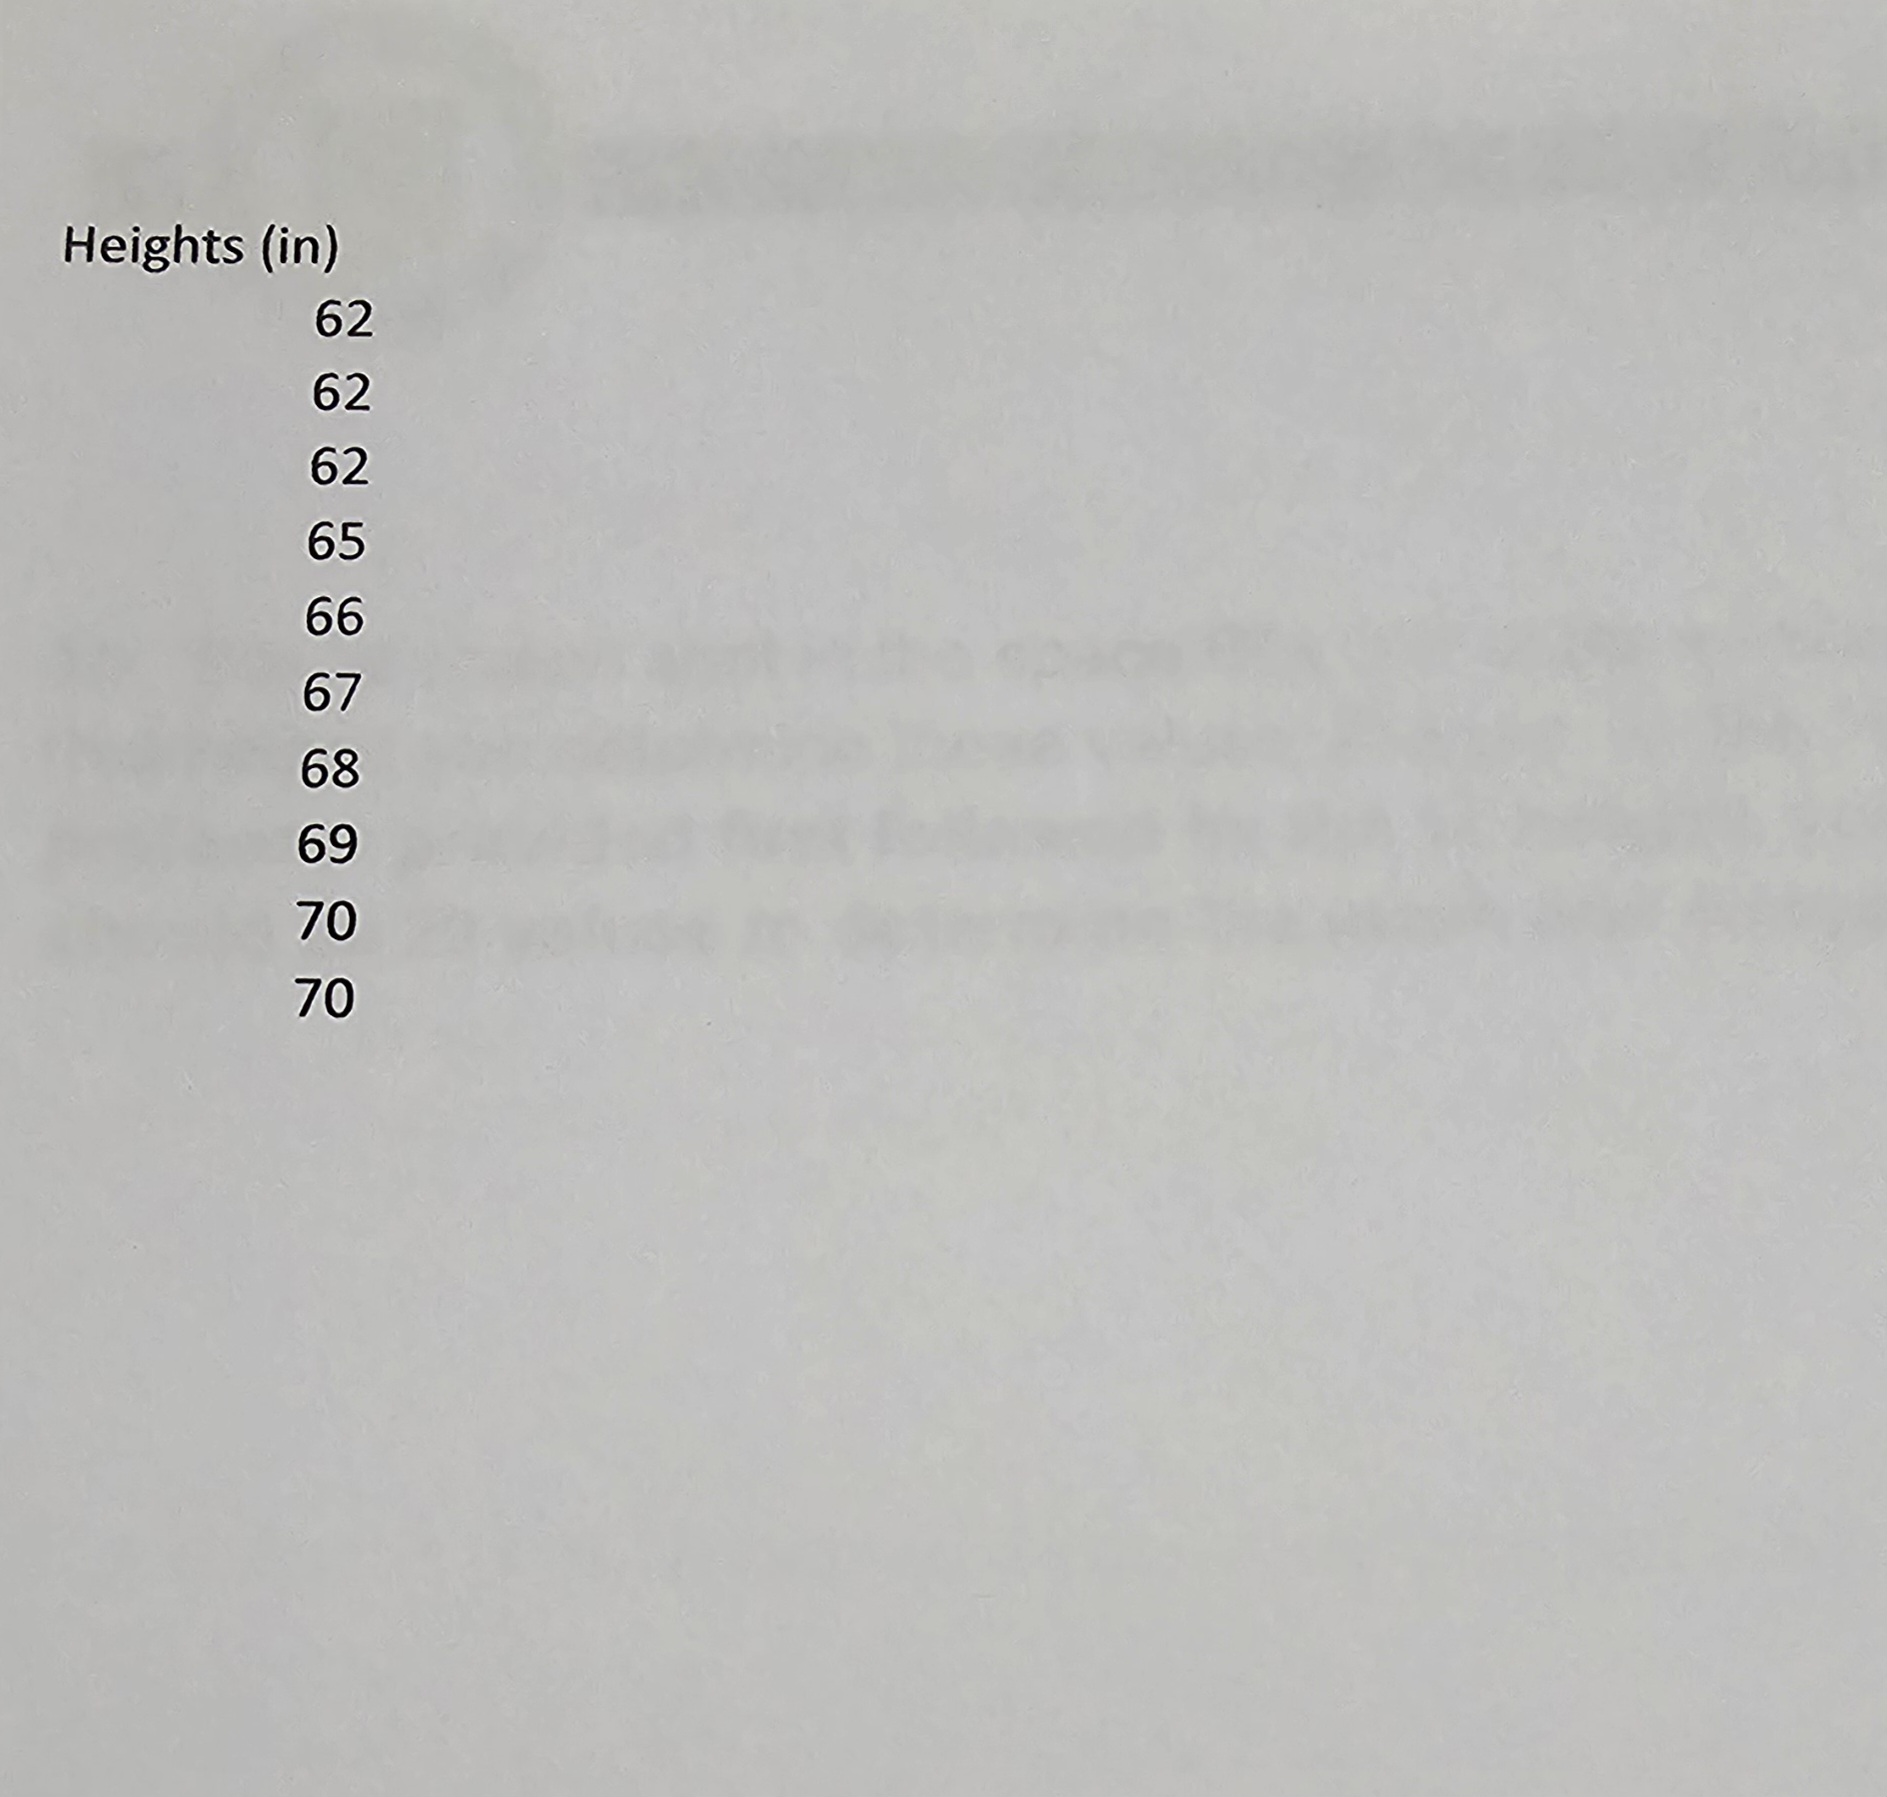

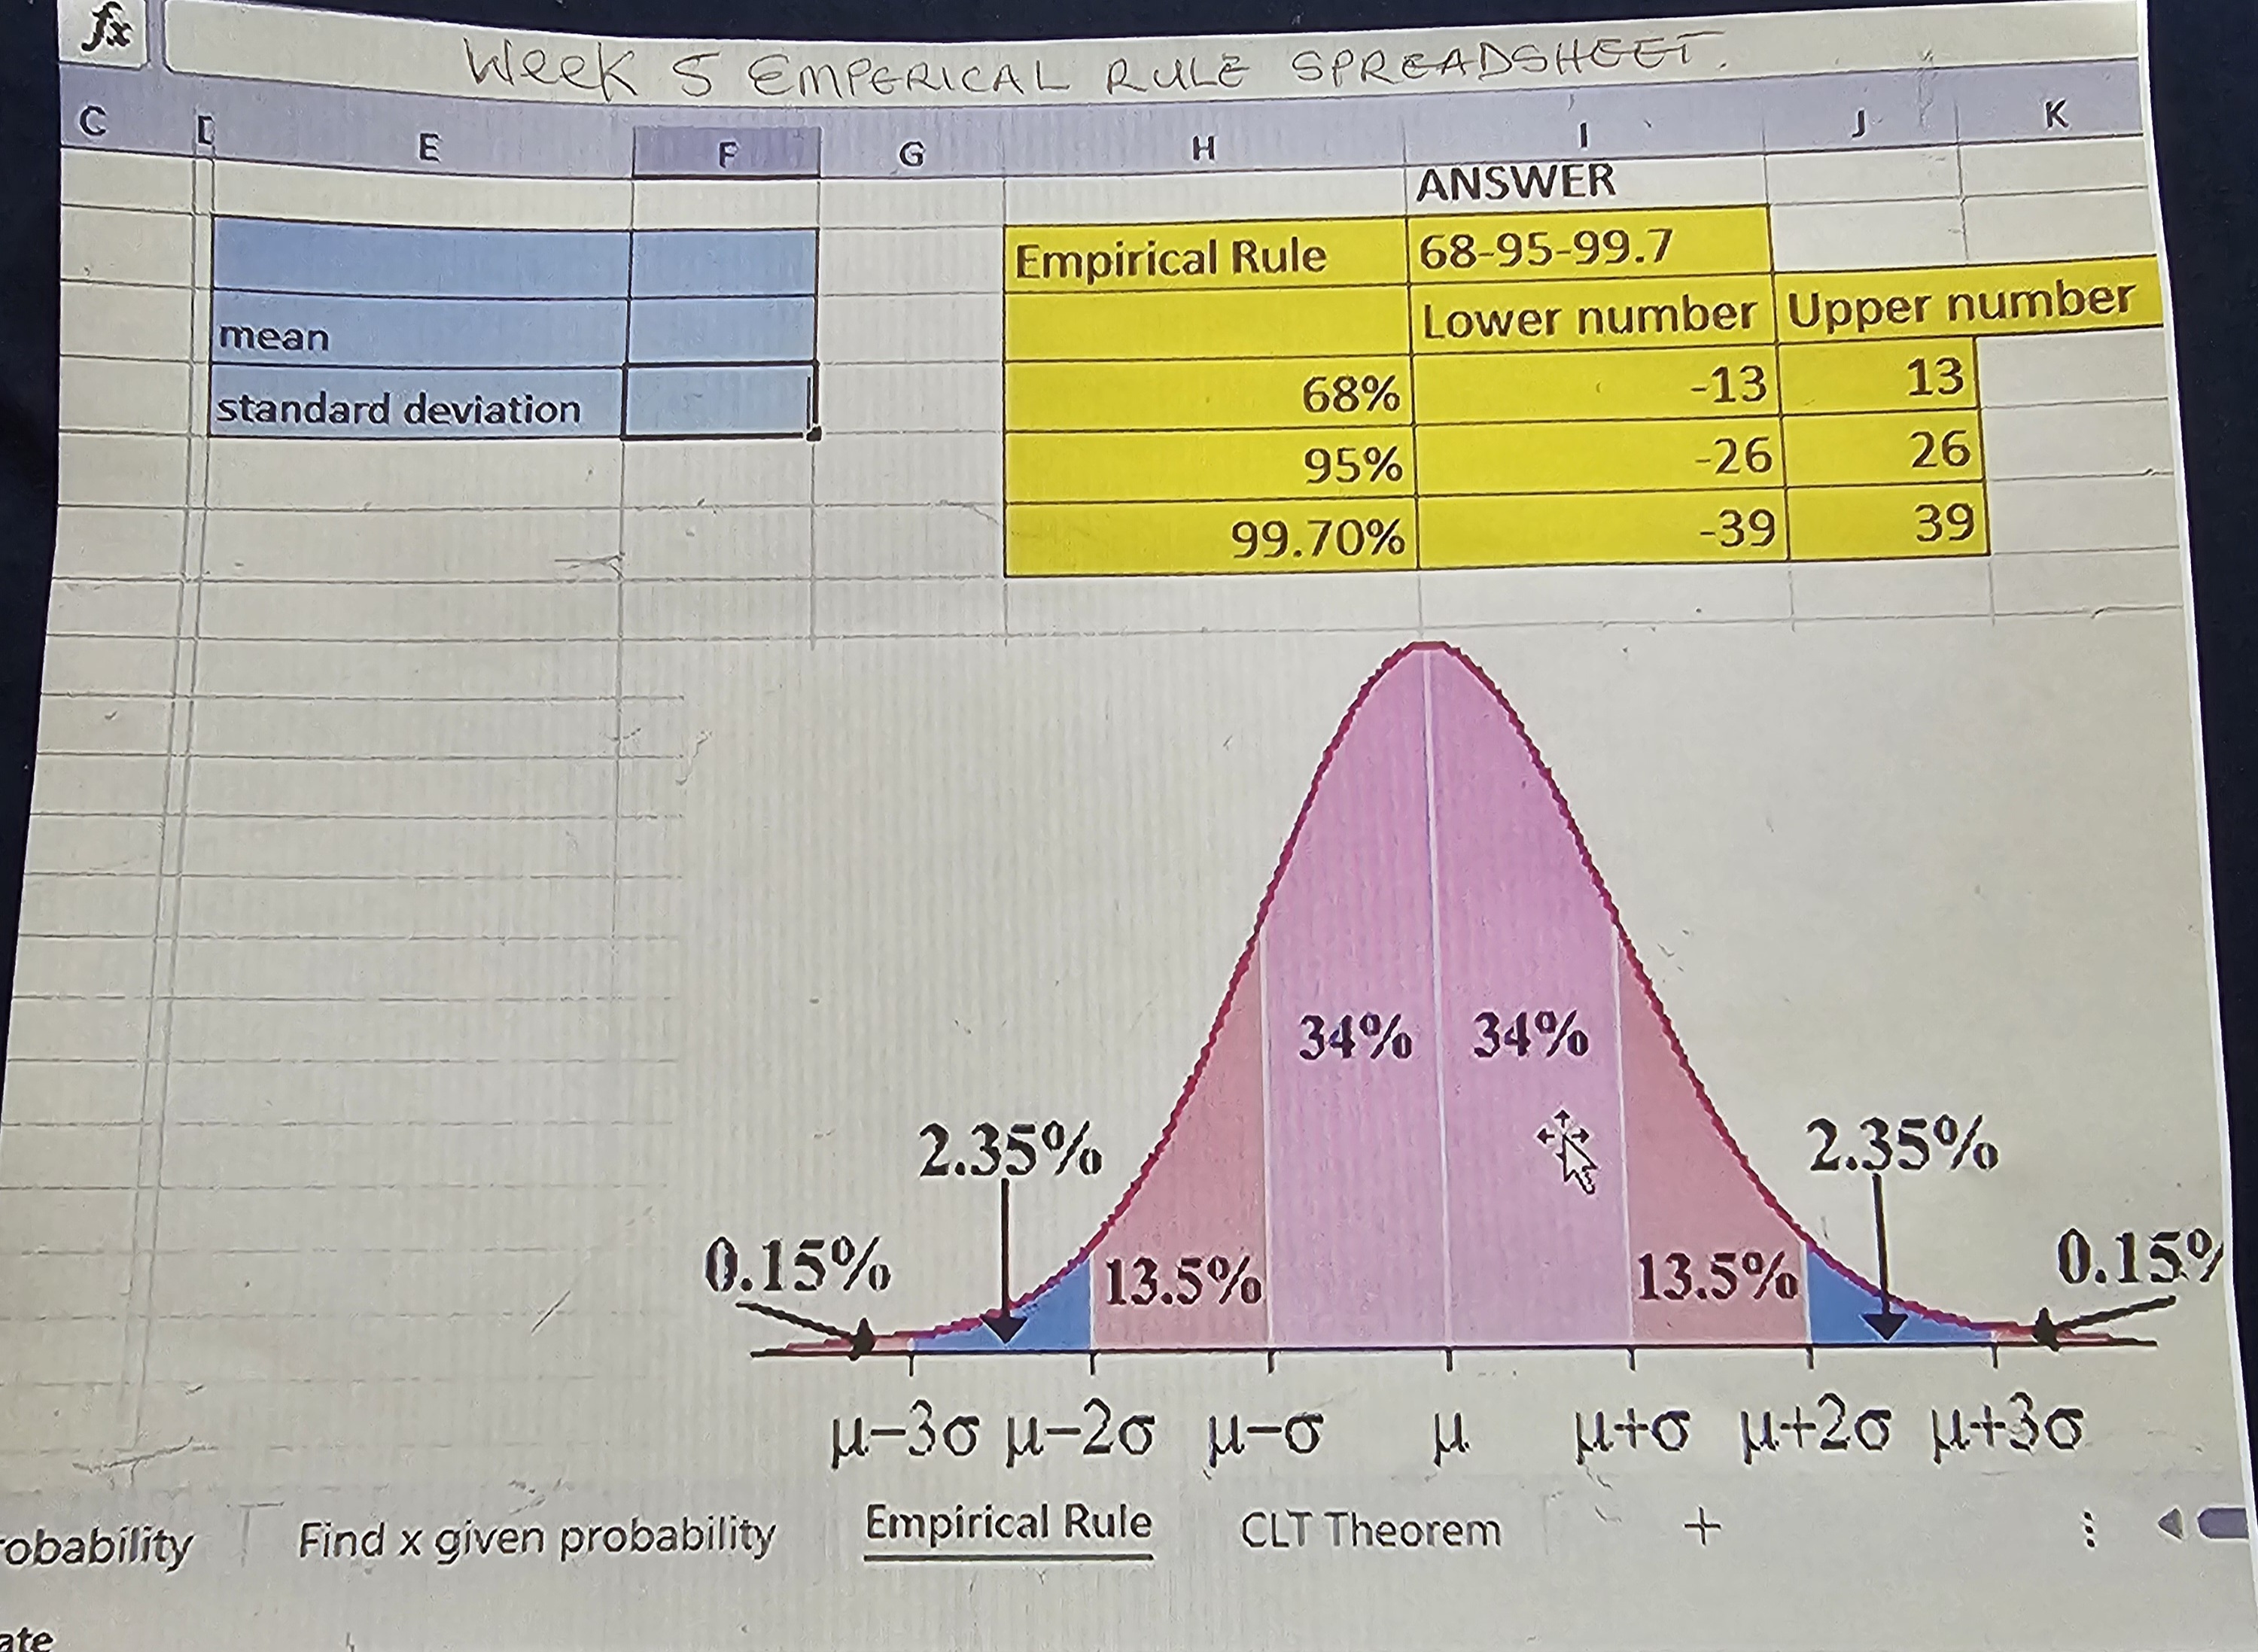
Week 5 Lab Assignment Name: Instructor Name: Please use this template to help answer the questions listed in the lab instructions. The "steps" below refer to the steps listed in the lab instructions. Type your answers and post your screenshots in the spaces given below. Then, save this document with your name and submit it inside the course room. Step 1. Gather Data Your instructors will post 10 data values to use for this lab. The data values represent the HEIGHTS of 10 people. 1a. Gather 10 MORE of your own to add to the 10 provided by your instructor. Do the following: Survey or measure 10 people to find their heights. Determine the mean and standard deviation for the 20 values by using the Week 3 Excel spreadsheet. (Round statistics to two decimals.) Mean Height in Inches Sample Standard Deviation in inches Your Height in Inches Galaxy S23 UltraHeights (in) 62 62 62 65 66 67 68 69 70 701b. Post a screen shot in the space BELOW of the portion of the spreadsheet that helped you determine these values. Please list the 10 heights your professor provided first followed by the 10 heights you collected. There should be 20 values to determine the mean and sample standard deviation. 1c. Answer the following two questions (Answer in complete sentences). How does your height compare to the mean (average) height of the 20 values? Is your height taller, shorter, or the same as the mean of the sample? 2 Galaxy S23 UltraCHAMBERLAIN 1100 9 Step 2. Data Characteristics Answer the following questions to give some background information on the group of people you used in your study. Write in complete sentences. 1. How did you choose the participants for your study? What was the sampling method: systematic, convenience, cluster, stratified, simple random? 2. What part of the country did your study take place in? 3. What are the age ranges of your participants? 4. How many of each gender did you have in your study? 5. What are other interesting factors about your group? Galaxy S23 UltraCHAMBERLAIN Step 3. Data Analysis Answer the following questions. Use the Week 5 Excel spreadsheets to help analyze the data. Empirical Rule 1. Determine the 68%, 95%, and 99.7% values of the Empirical Rule in terms of the 20 heights in your height study. (Use the Empirical Rule tab from the spreadsheet). 2. What do these values tell you? Write complete sentences explaining what the values in the Empirical Rule tell you in context of the data. 3. Take a Screenshot of your Empirical Rule Sheet (Week 5 Spreadsheet) and provide it below Normal Distribution 1. Take a Screenshot of your Normal Distribution Sheet and provide it below Galaxy S23 Ultra2. Based on your study results, what percent of the study participants are shorter than you? What percent are taller? Galaxy S23 Ultra 5WeekSEMPERICAL RULE SPREADSHEET. C E F K G H ANSWER Empirical Rule 68-95-99.7 mean Lower number Upper number standard deviation 68% -13 13 95% 26 26 99.70% -39 39 34% 34% 2.35% 2.35% 0.15% 13.5% 13.5% 0.159 M-30 M-20 M-O M. Mto M+20 1+30 obability Find x given probability Empirical Rule CLT Theorem
Step by Step Solution
There are 3 Steps involved in it

Get step-by-step solutions from verified subject matter experts