

Question: week 5th assignment 5th-week assignment data will you please give me the answer to Step3 I use simple random method- The participants for this study
week 5th assignment
5th-week assignment data
will you please give me the answer to Step3
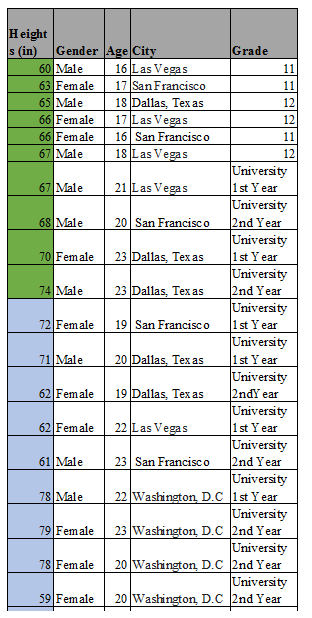
- I use simple random method-The participants for this study were randomly selected using the simple random method. The survey was taken in different cities in the United States of America. The age ranges of the participants are between 16 years and 23 years. The selected sample size had nine males and eleven females. It is worth noting that the chosen sample group was students ranging between grade 11 and university second year.
Step 3: Using the data you collected for the Week 5 Lab (heights of 10 different people that you work withplusthe 10 heights provided by your instructor), discuss your method of collection for the values that you are using in your study (systematic, convenience, cluster, stratified, simple random). What are some faults with this type of data collection? What other types of data collection could you have used, and how might this have affected your study?
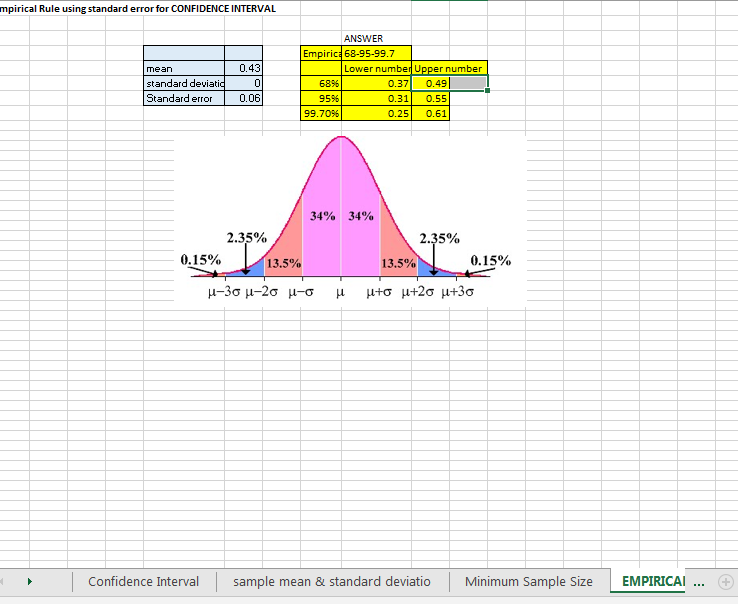
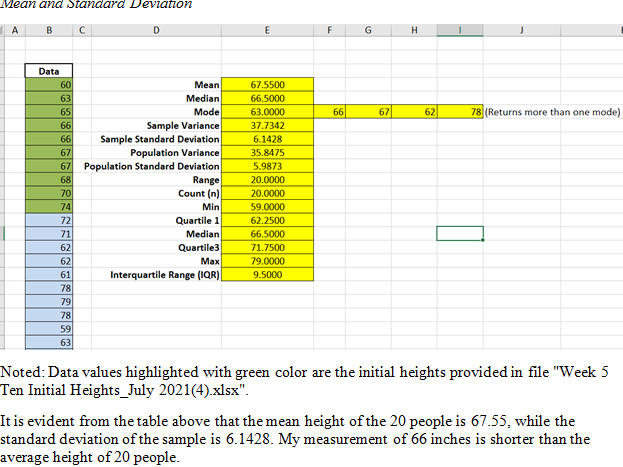
npirical Rule using standard error for CONFIDENCE INTERVAL ANSWER Empirice 68-95-99.7 mean 0.43 ower number Upper number standard deviatio 0.37 0.49 Standard error 0.06 35% 0.31 0.55 99.7096 0.25 0.61 34% 34% 2.35% 2.35% 0.15% 13.5% 13.5% 0.15% H-30 4-20 4-G A uto +20 1+30 Confidence Interval sample mean & standard deviatio Minimum Sample Size EMPIRICAl ... (+Mean and Standard Deviation A B C D E F G H I Data 60 Mean 67.5500 63 Median 66.5000 65 Mode 63.0000 66 67 62 78 (Returns more than one mode) 66 Sample Variance 37.7342 66 Sample Standard Deviation 6.1428 67 Population Variance 35.8475 67 Population Standard Deviation 5.9873 68 Range 20.0000 70 Count (n) 20.0000 74 Min 59.0000 72 Quartile 1 62.2500 71 Median 66.5000 621 Quartile3 71.7500 62 Max 79.0000 61 Interquartile Range (IOR) 9.5000 78 79 78 59 63 Noted: Data values highlighted with green color are the initial heights provided in file "Week 5 Ten Initial Heights_July 2021(4).xlsx". It is evident from the table above that the mean height of the 20 people is 67.55, while the standard deviation of the sample is 6.1428. My measurement of 66 inches is shorter than the average height of 20 people.
Step by Step Solution
There are 3 Steps involved in it

Get step-by-step solutions from verified subject matter experts