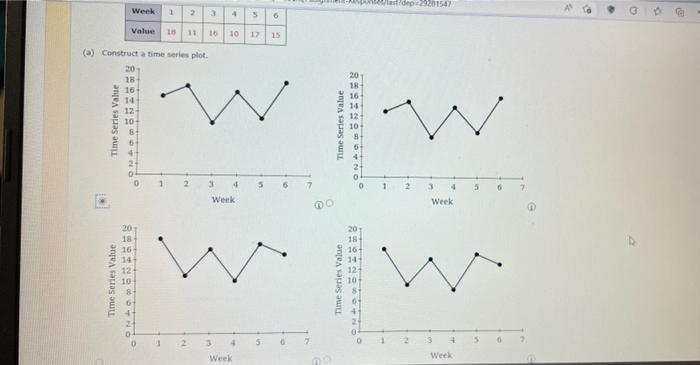
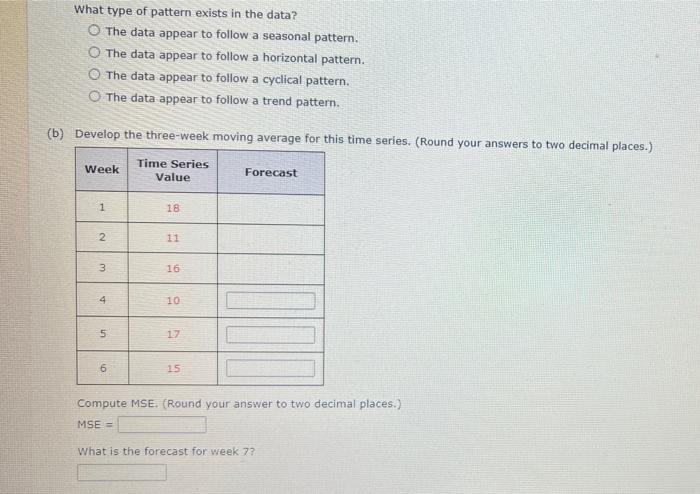
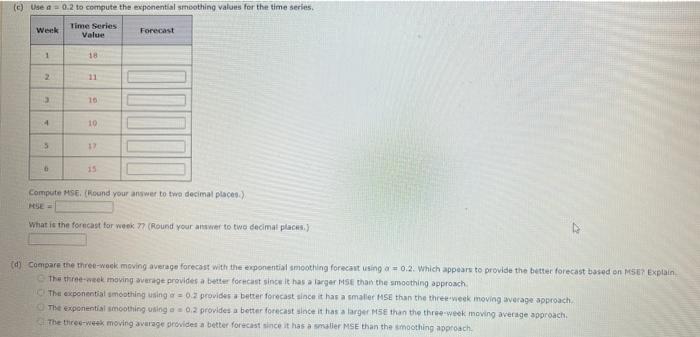
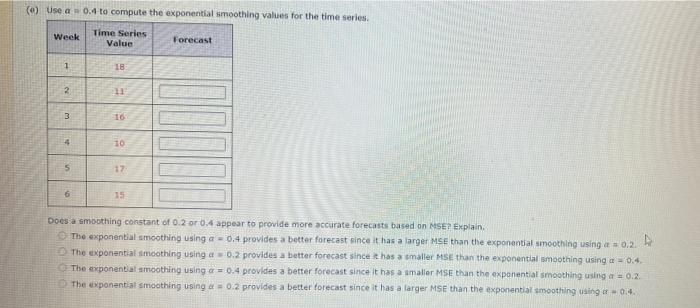
Question: Week Value 18 11 Time Series Value 1 2 13 4 5 (a) Construct a time series plot. 20- 18- 16 14 12 10- 16

Week Value 18 11 Time Series Value 1 2 13 4 5 (a)
Week Value 18 11 Time Series Value 1 2 13 4 5 (a) Construct a time series plot. 20- 18- 16 14 12 10- 16 2 10 17 15 6 20 18- ww Week Week @O to 1/dep 29201547 1 2 3 4 Week Week What type of pattern exists in the data? O The data appear to follow a seasonal pattern. O The data appear to follow a horizontal pattern. O The data appear to follow a cyclical pattern. O The data appear to follow a trend pattern. (b) Develop the three-week moving average for this time series. (Round your answers to two decimal places.) Time Series Value Week 1 2 3 4 in 5 6 18 11 16 10 17 15 Forecast Compute MSE. (Round your answer to two decimal places.) MSE = What is the forecast for week 7? (c) Use a = 0.2 to compute the exponential smoothing values for the time series. Time Series Value Week 1 2 3 4 3 6 18 10 10 17 15 Forecast Compute MSE. (Round your answer to two decimal places.) What is the forecast for week 77 (Round your answer to two decimal places.) (d) Compare the three-week moving average forecast with the exponential smoothing forecast using a 0.2. Which appears to provide the better forecast based on MSE? Explain. The three-week moving average provides a better forecast since it has a larger MSE than the smoothing approach. The exponential smoothing using a = 0.2 provides a better forecast since it has a smaller MSE than the three-week moving average approach. The exponential smoothing using a 0.2 provides a better forecast since it has a larger MSE than the three-week moving average approach. The three-week moving average provides a better forecast since it has a smaller MSE than the smoothing approach. (0) Use a 0.4 to compute the exponential smoothing values for the time series. Time Series Value. Week 1 2 3 4 5 6 18 11 16 10 17. 15 Forecast Does a smoothing constant of 0.2 or 0.4 appear to provide more accurate forecasts based on MSE? Explain. The exponential smoothing using a 0.4 provides a better forecast since it has a larger MSE than the exponential smoothing using a = 0.2. 4 The exponential smoothing using a 0.2 provides a better forecast since it has a smaller MSE than the exponential smoothing using a = 0.4. The exponential smoothing using a = 0.4 provides a better forecast since it has a smaller MSE than the exponential smoothing using a = 0.2. The exponential smoothing using a = 0.2 provides a better forecast since it has a larger MSE than the exponential smoothing using or=0.4

Step by Step Solution

There are 3 Steps involved in it

1 Expert Approved Answer
Step: 1 Unlock blur-text-image
Question Has Been Solved by an Expert!

Get step-by-step solutions from verified subject matter experts

Step: 2 Unlock
Step: 3 Unlock

Students Have Also Explored These Related General Management Questions!