

Question: We'll soon see that the solution to diffusion in a beaker that initially contains a separate mixture in the top and bottom can be described
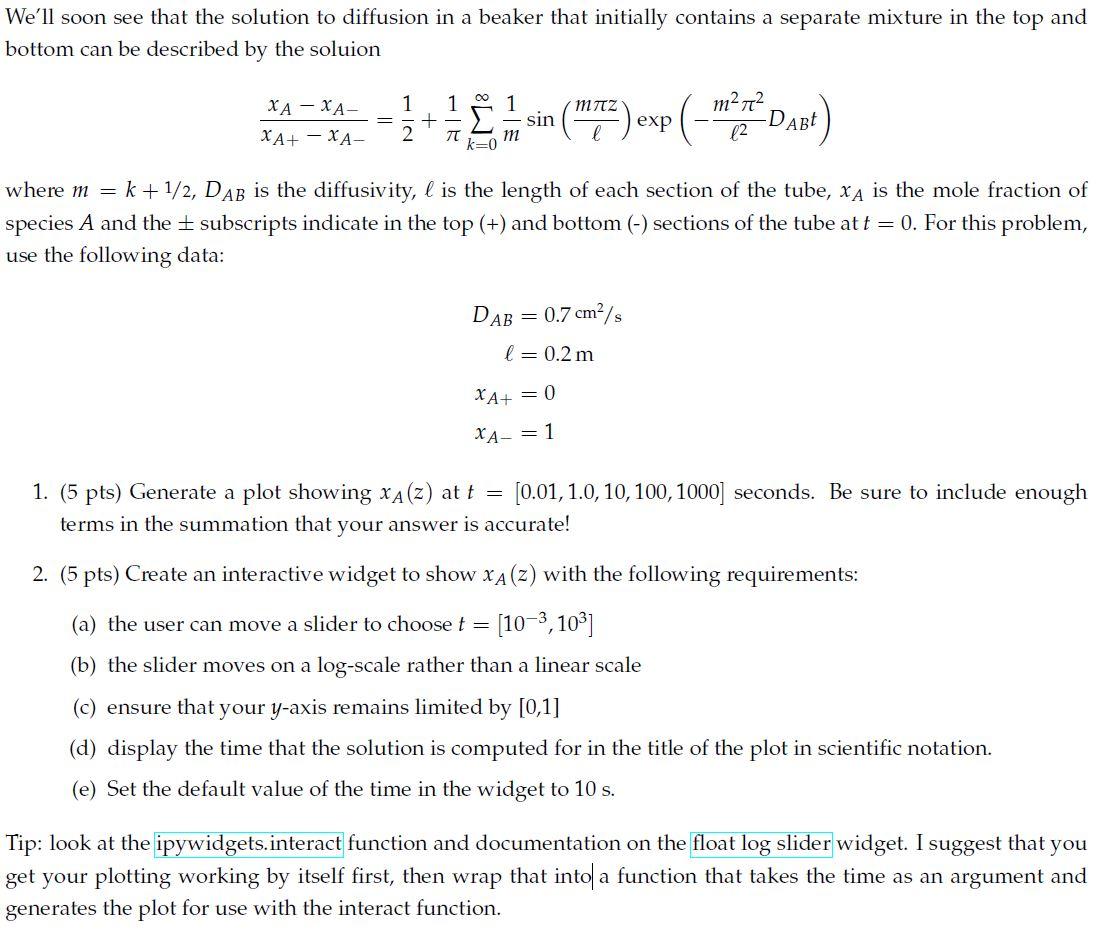
We'll soon see that the solution to diffusion in a beaker that initially contains a separate mixture in the top and bottom can be described by the soluion xA+xAxAxA=21+1k=0m1sin(mz)exp(2m22DABt) where m=k+1/2,DAB is the diffusivity, is the length of each section of the tube, xA is the mole fraction of species A and the subscripts indicate in the top (+) and bottom () sections of the tube at t=0. For this problem, use the following data: DABxA+xA=0.7cm2/s=0.2m=0=1 1. (5 pts) Generate a plot showing xA(z) at t=[0.01,1.0,10,100,1000] seconds. Be sure to include enough terms in the summation that your answer is accurate! 2. (5 pts) Create an interactive widget to show xA(z) with the following requirements: (a) the user can move a slider to choose t=[103,103] (b) the slider moves on a log-scale rather than a linear scale (c) ensure that your y-axis remains limited by [0,1] (d) display the time that the solution is computed for in the title of the plot in scientific notation. (e) Set the default value of the time in the widget to 10s. Tip: look at the ipywidgets.interact function and documentation on the widget. I suggest that you get your plotting working by itself first, then wrap that into a function that takes the time as an argument and generates the plot for use with the interact function
Step by Step Solution
There are 3 Steps involved in it

Get step-by-step solutions from verified subject matter experts