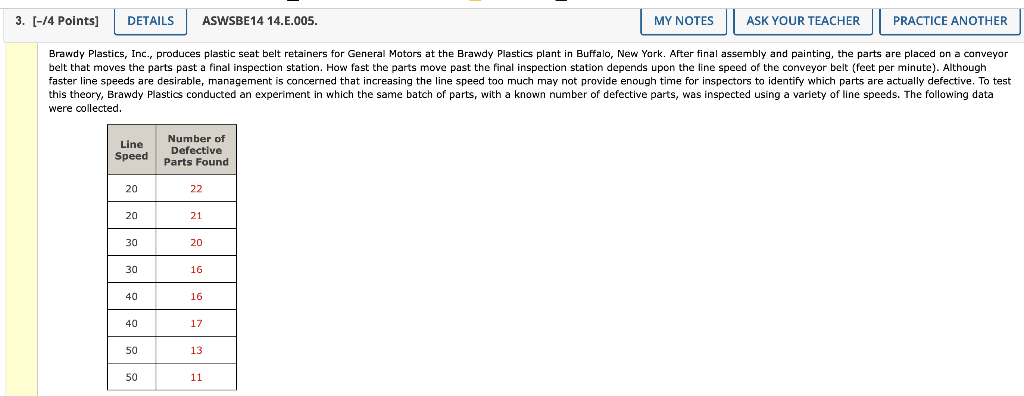
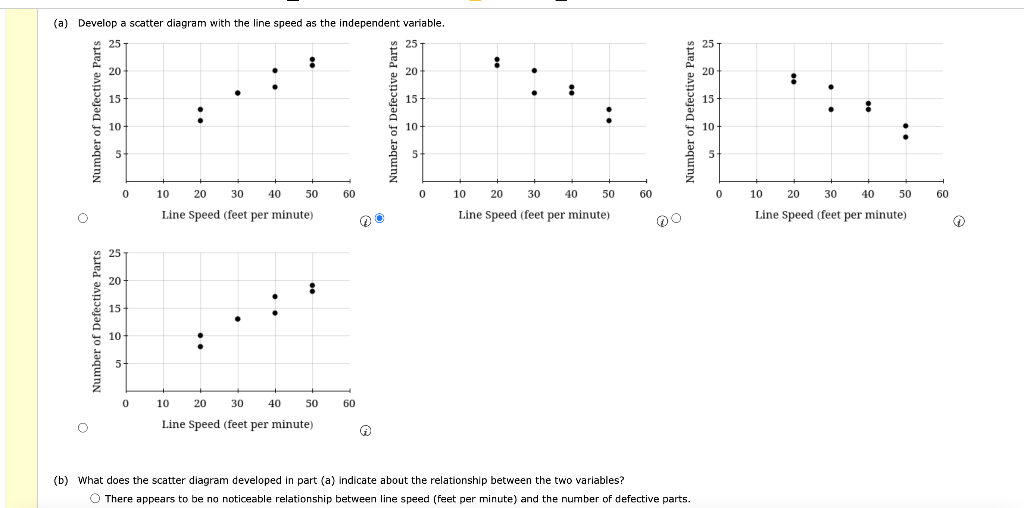
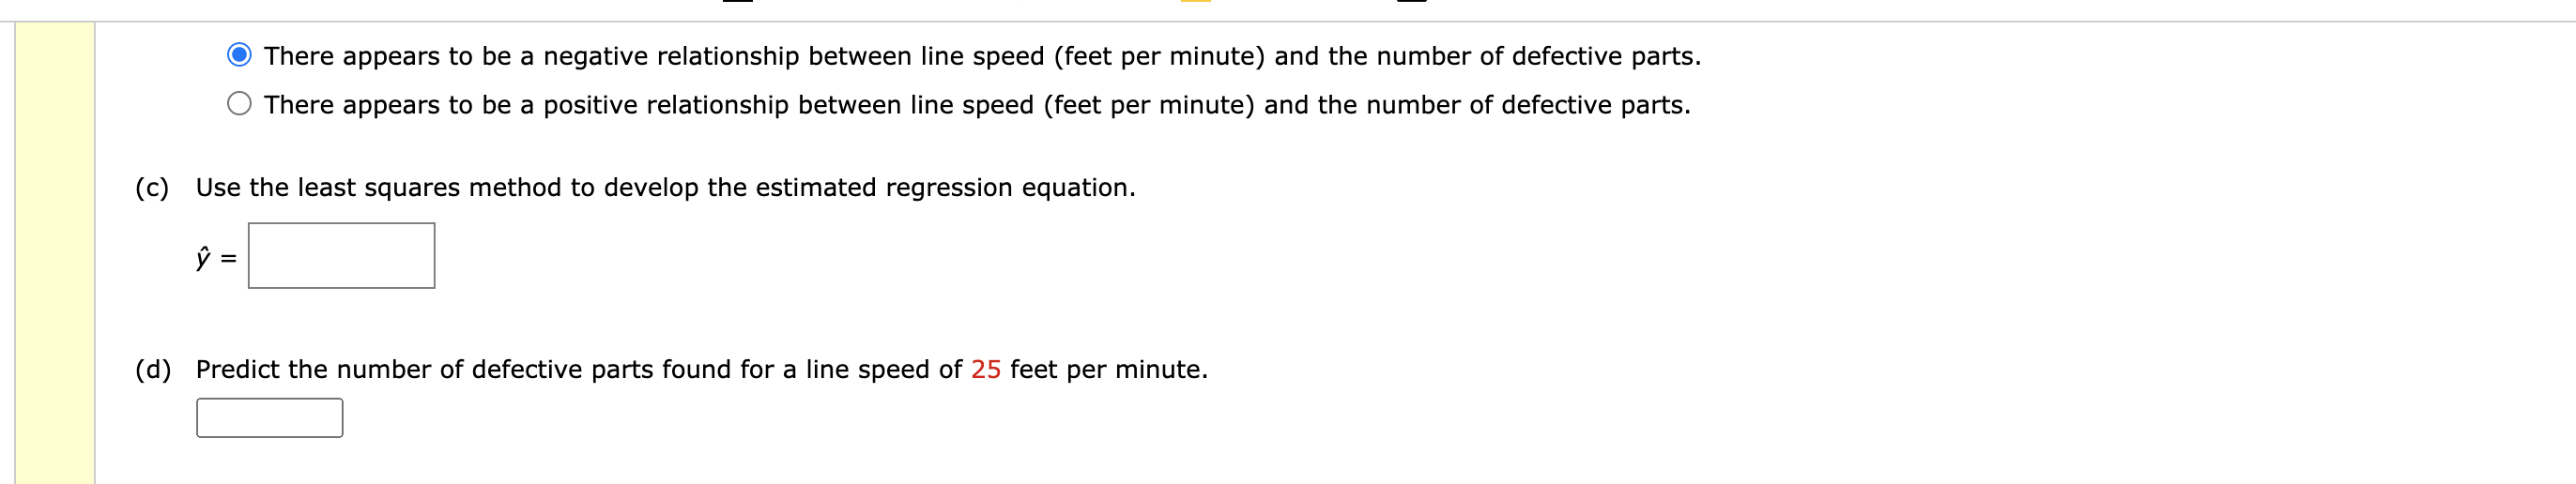
Question: were collected. (a) Develop a scatter diagram with the line speed as the independent variable. (b) What does the scatter diagram developed in part (a)

were collected. (a) Develop a scatter diagramwere collected. (a) Develop a scatter diagramwere collected. (a) Develop a scatter diagram

were collected. (a) Develop a scatter diagram with the line speed as the independent variable. (b) What does the scatter diagram developed in part (a) indicate about the relationship between the two variables? There appears to be no noticeable relationship between line speed (feet per minute) and the number of defective parts. There appears to be a negative relationship between line speed (feet per minute) and the number of defective parts. There appears to be a positive relationship between line speed (feet per minute) and the number of defective parts. (c) Use the least squares method to develop the estimated regression equation. y^= (d) Predict the number of defective parts found for a line speed of 25 feet per minute

Step by Step Solution

There are 3 Steps involved in it

1 Expert Approved Answer
Step: 1 Unlock blur-text-image
Question Has Been Solved by an Expert!

Get step-by-step solutions from verified subject matter experts

Step: 2 Unlock
Step: 3 Unlock

Students Have Also Explored These Related General Management Questions!