

Question: Need some help with Regression problems .. In order, and numbered 1 f(a) Develop a scatter diagram with the line speed as the independent variable.


Need some help with Regression problems .. In order, and numbered
1
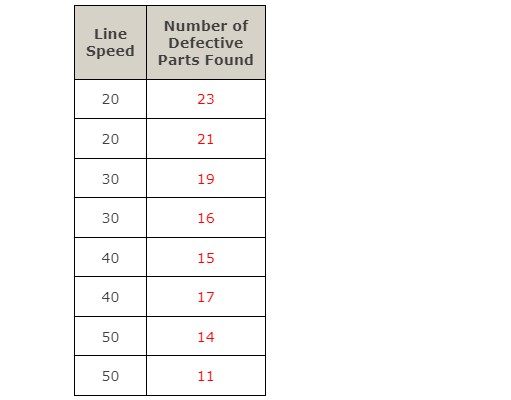

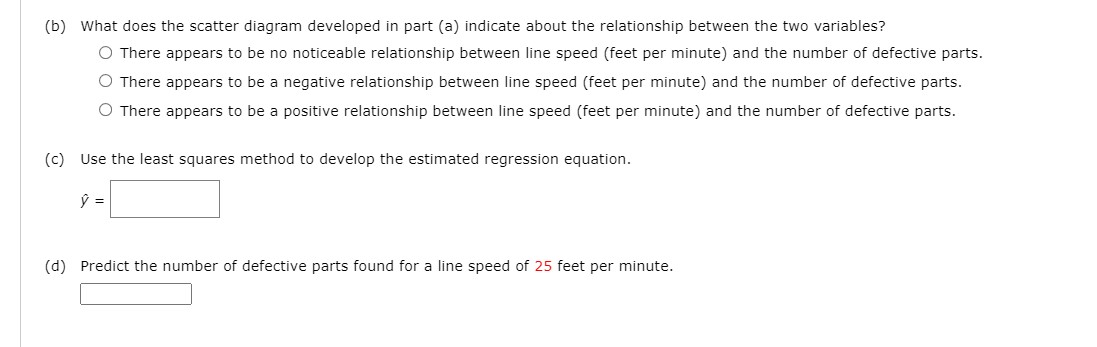
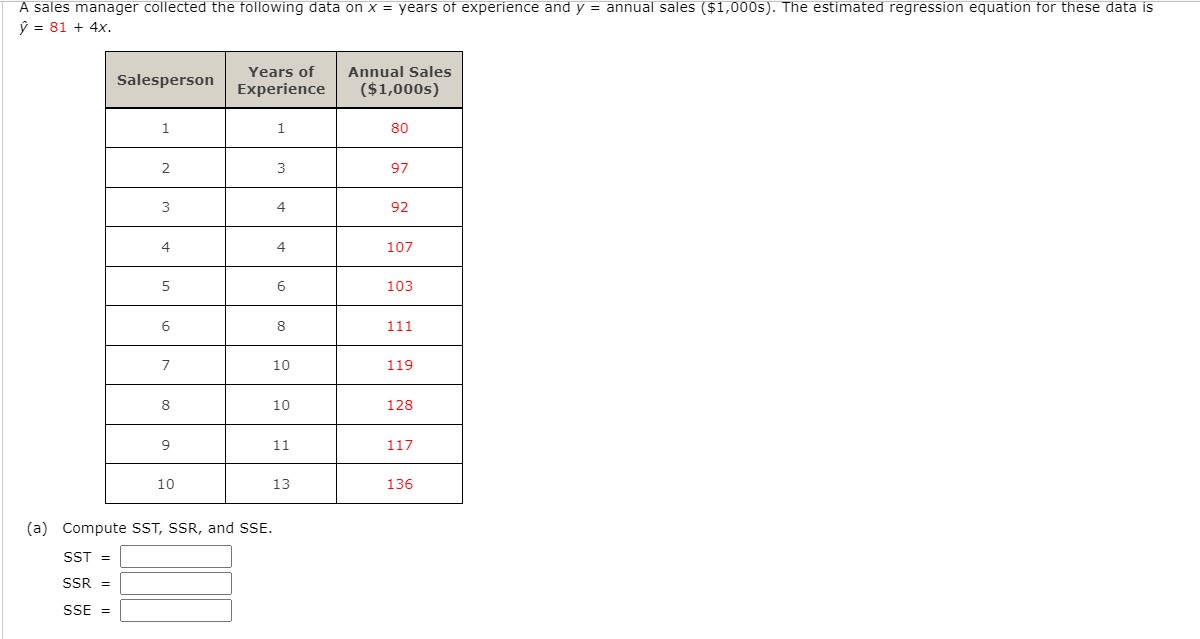


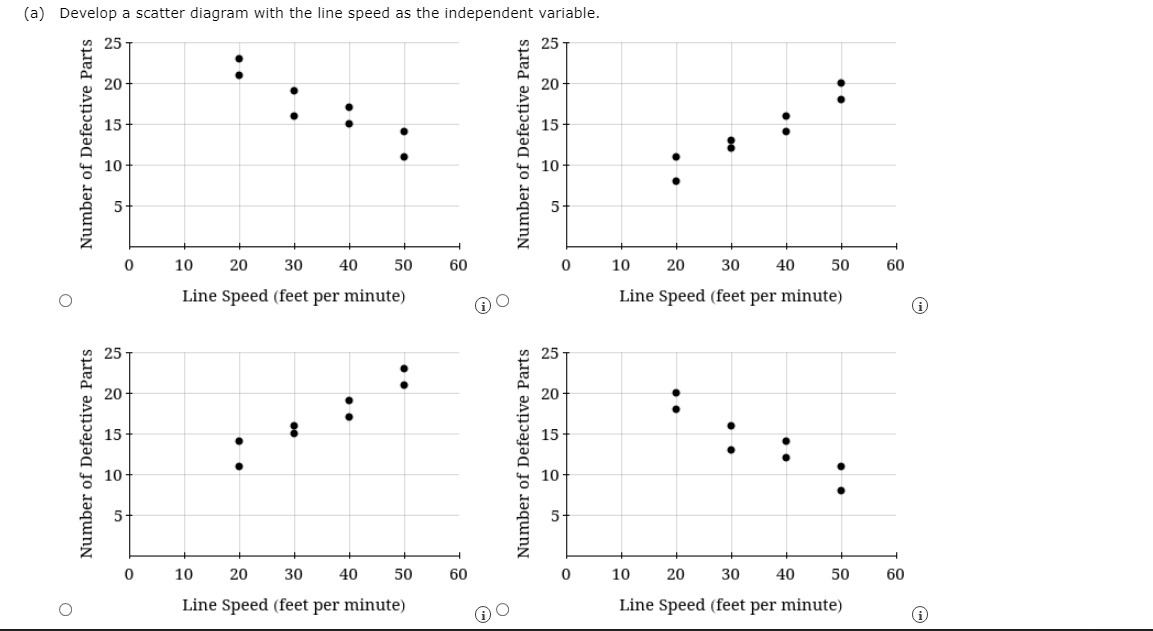
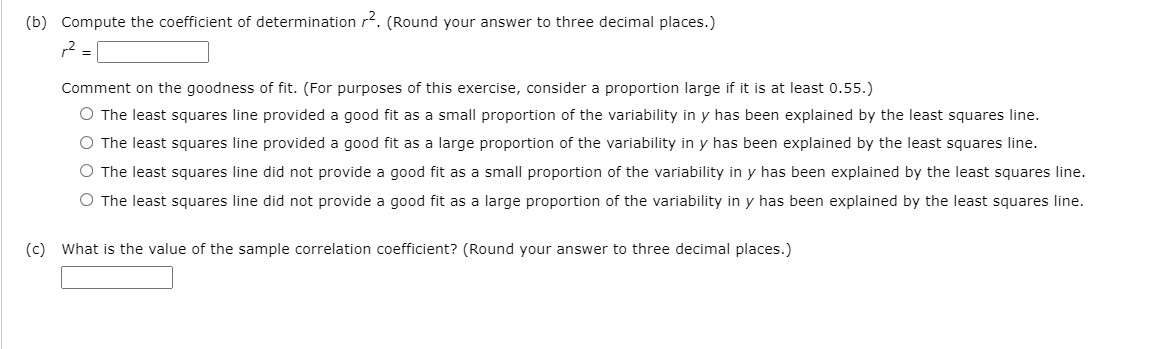
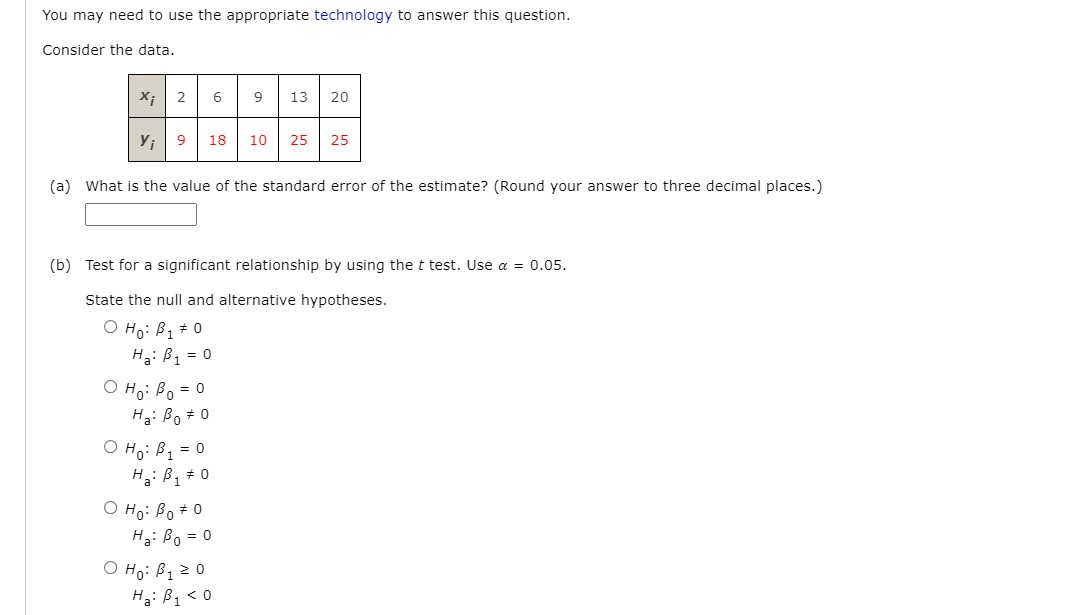
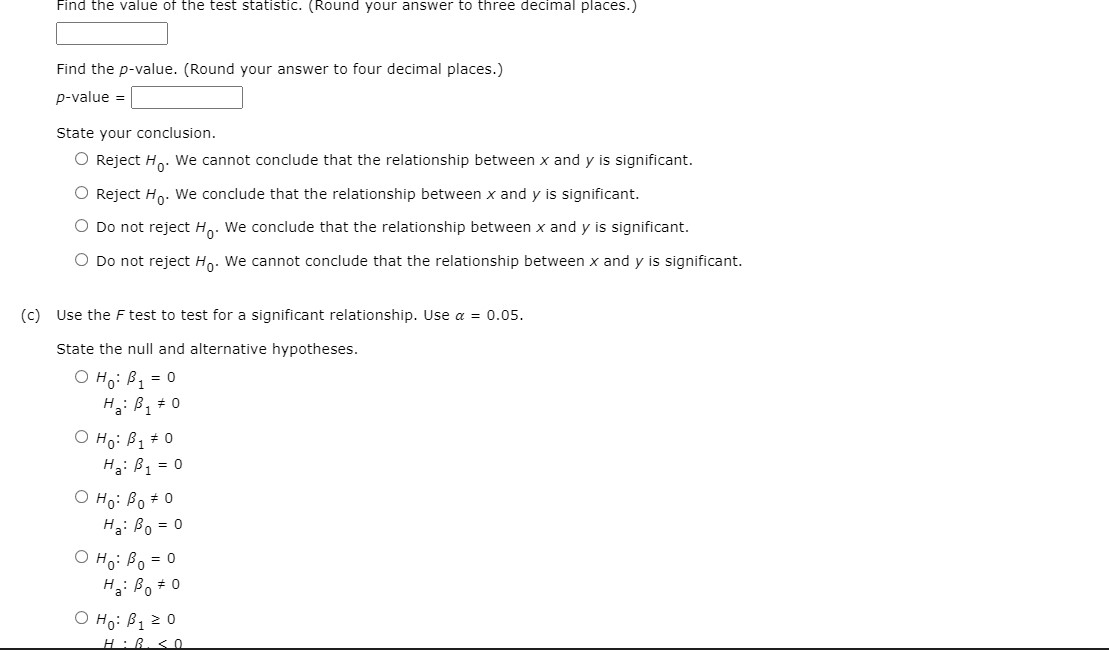
\f(a) Develop a scatter diagram with the line speed as the independent variable. 25 25 20 20 15 15 Number of Defective Parts Number of Defective Parts 10 10 5 0 10 20 30 40 50 60 0 10 20 30 40 50 60 O Line Speed (feet per minute) Line Speed (feet per minute) 25 25 20 20 15 15 Number of Defective Parts Number of Defective Parts 10 10 5 5 0 10 20 30 40 50 60 0 10 20 30 40 50 60 O Line Speed (feet per minute) Line Speed (feet per minute) A(b) What does the scatter diagram developed in part (a) indicate about the relationship between the two variables? 0 There appears to be no noticeable relationship between line speed (feet per minute) and the number of defective parts. 0 There appears to be a negative relationship between line speed (feet per minute) and the number of defective parts. 0 There appears to be a positive relationship between line speed (feet per minute) and the number of defective parts. (c) Use the least squares method to develop the estimated regression equation. j}: (d) Predict the number of defective parts found for a line speed of 25 feet per minute. : A sales manager collected the following data on x = years of experience and y = annual sales ($1,000s). The estimated regression equation for these data is y = 81 + 4x. Salesperson Years of Annual Sales Experience ($1,000s) 1 80 2 3 97 3 4 92 4 4 107 5 6 103 6 8 111 7 10 119 8 10 128 9 11 117 10 13 136 (a) Compute SST, SSR, and SSE. SST = SSR : SSE =(b) Compute the coefficient of determination . (Round your answer to three decimal places.) 12 = Comment on the goodness of fit. (For purposes of this exercise, consider a proportion large if it is at least 0.55.) The least squares line provided a good fit as a small proportion of the variability in y has been explained by the least squares line. O The least squares line provided a good fit as a large proportion of the variability in y has been explained by the least squares line. The least squares line did not provide a good fit as a small proportion of the variability in y has been explained by the least squares line. The least squares line did not provide a good fit as a large proportion of the variability in y has been explained by the least squares line. (c) What is the value of the sample correlation coefficient? (Round your answer to three decimal places.)You may need to use the appropriate technology to answer this question. Consider the data. Xi 2 6 9 13 20 9 18 10 25 25 (a) What is the value of the standard error of the estimate? (Round your answer to three decimal places.) (b) Test for a significant relationship by using the t test. Use a = 0.05. State the null and alternative hypotheses. OH: B, # 0 HA : B 1 = 0 OH: Bo = 0 Ha: Bo # 0 OH : B , = 0 H: B , +0 O Ho: Bo # 0 Ha: Bo = 0 OH: B1 20 Ha: B1
Step by Step Solution
There are 3 Steps involved in it

Get step-by-step solutions from verified subject matter experts