

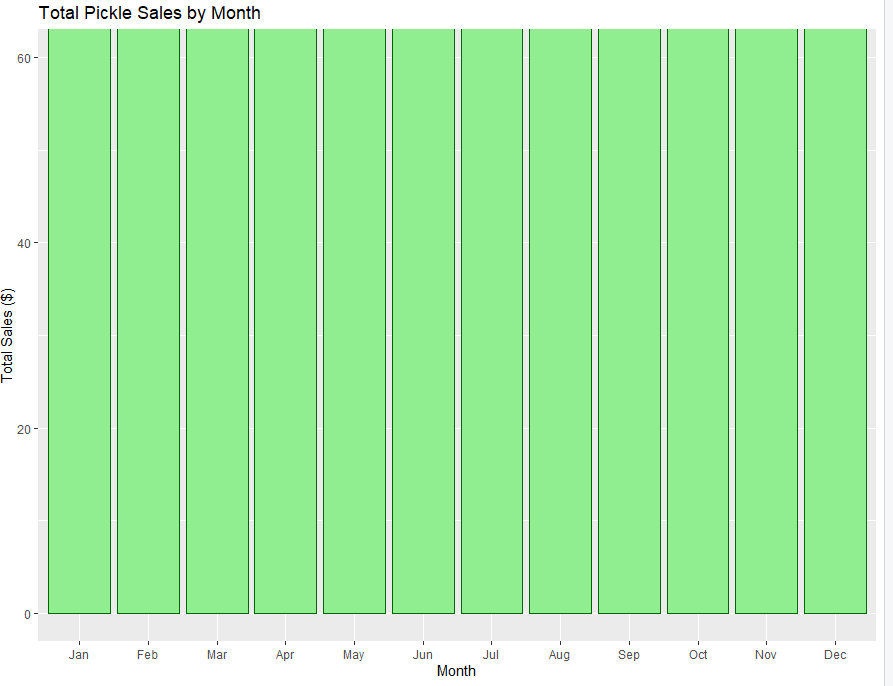
Question: What am I missing to why my plot is all the same and not counting the actual total sales amount?Total Pickle Sales by Month tot
What am I missing to why my plot is all the same and not counting the actual total sales amount?Total Pickle Sales by Month
totpick products
filterstrdetectproducttype, regexpickles ignorecase TRUE
innerjointransactions by "productid
groupbyMonth monthtransactiontimestamp, label TRUE, abbr TRUE
mutatemonth monthtransactiontimestamp
summarisetotalsales sumsalesvalue
totpick
ggplotaesMonth totalsales
coordcartesianylim c
geomcolfill "lightgreen", color "darkgreen"
labstitle "Total Pickle Sales by Month",
x "Month",
y "Total Sales $
Step by Step Solution
There are 3 Steps involved in it
1 Expert Approved Answer
Step: 1 Unlock

Question Has Been Solved by an Expert!
Get step-by-step solutions from verified subject matter experts
Step: 2 Unlock
Step: 3 Unlock