

Question: What are teh CI=confidence interval, OR = odds ratio, P value=probability of null value hypothesis for the following tables. The data collected in the tables
What are teh CI=confidence interval, OR = odds ratio, P value=probability of null value hypothesis for the following tables. The data collected in the tables aims to show an association between people with diabetes and muscle loss.
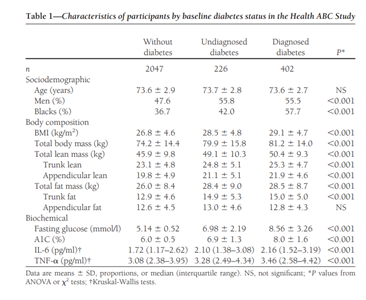
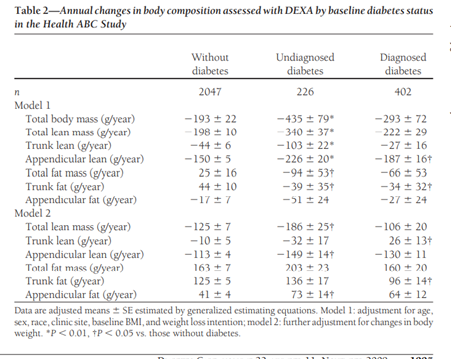
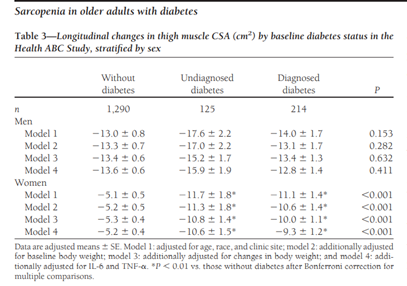
Table 1-Characteristics of participants by baseline diabetes status in the Health ABC Study Withour Undiagnosed Diagnosed diabetes diabetes diabetes 2047 220 402 Sociodemographic Age (years) 73.6 # 2.9 737 4 28 73.6 2.7 NS Men (20) 47.6 55.8 55.5 40.001 Blacks (1) 36.7 42.0 57.7 0.001 Body composition BMI (ky'm ) 26.8 = 4.6 285 # 4.8 29.1 # 4.7 40.001 Total body mass (kg) 74.2 = 14.4 79.9 + 15.8 81 2 + 140 30.001 Total lean mass (kg) 45.9 9.8 49.1 # 10.3 50.4 _ 9.3 40.001 Trunk lean 331 4.8 24.8 # 51 253 = 4.7 40.001 Appendicular lean 19.8 = 4.9 21.1 + 5.1 21.9 # 4.6
Step by Step Solution
There are 3 Steps involved in it

Get step-by-step solutions from verified subject matter experts