

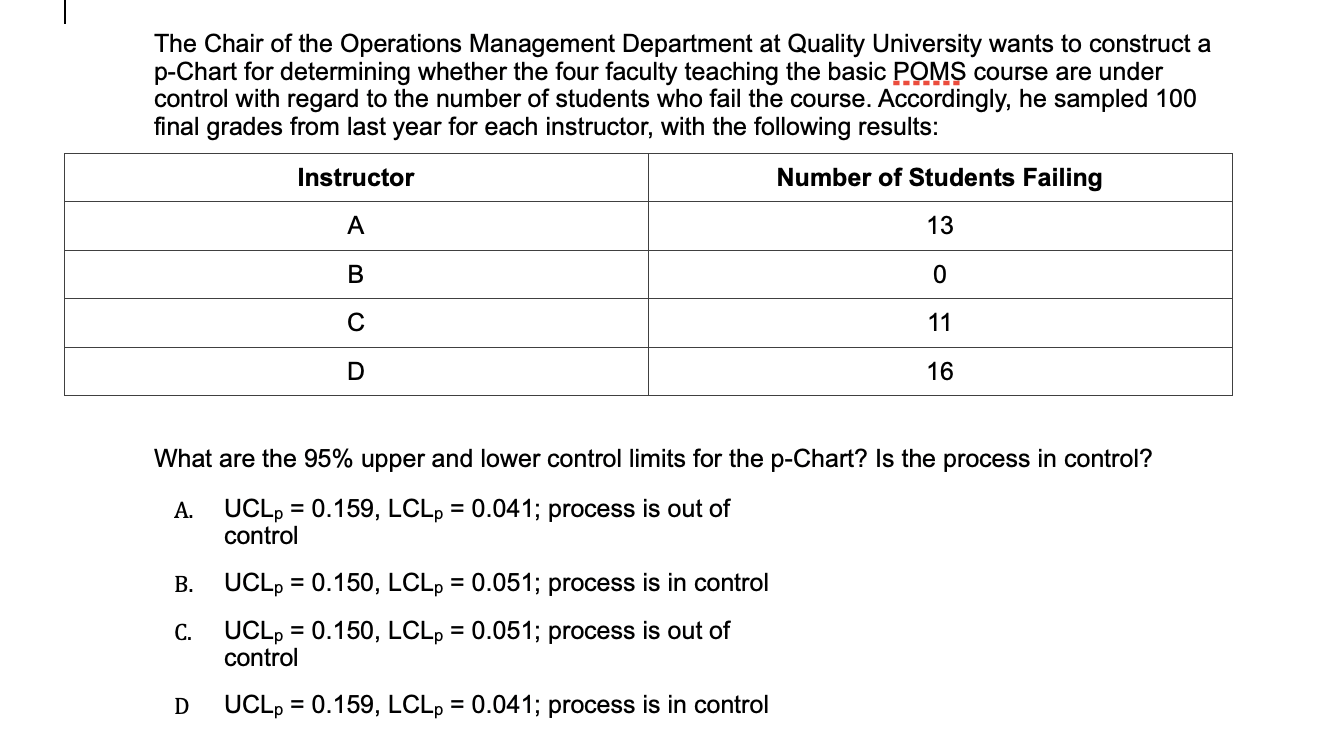
Question: What are the 9 5 % upper and lower control limits for the p - Chart? Is the process in control? A . U C
What are the upper and lower control limits for the pChart? Is the process in control?
A; process is out of
control
B; process is in control
C; process is out of
control
D ; process is in control
Step by Step Solution
There are 3 Steps involved in it
1 Expert Approved Answer
Step: 1 Unlock

Question Has Been Solved by an Expert!
Get step-by-step solutions from verified subject matter experts
Step: 2 Unlock
Step: 3 Unlock