

Question: What are the answers for the problems below? please give me explanations as well. please ignore the random line or number. thank you. this is
What are the answers for the problems below? please give me explanations as well. please ignore the random line or number. thank you. this is from cliff ap statistics book
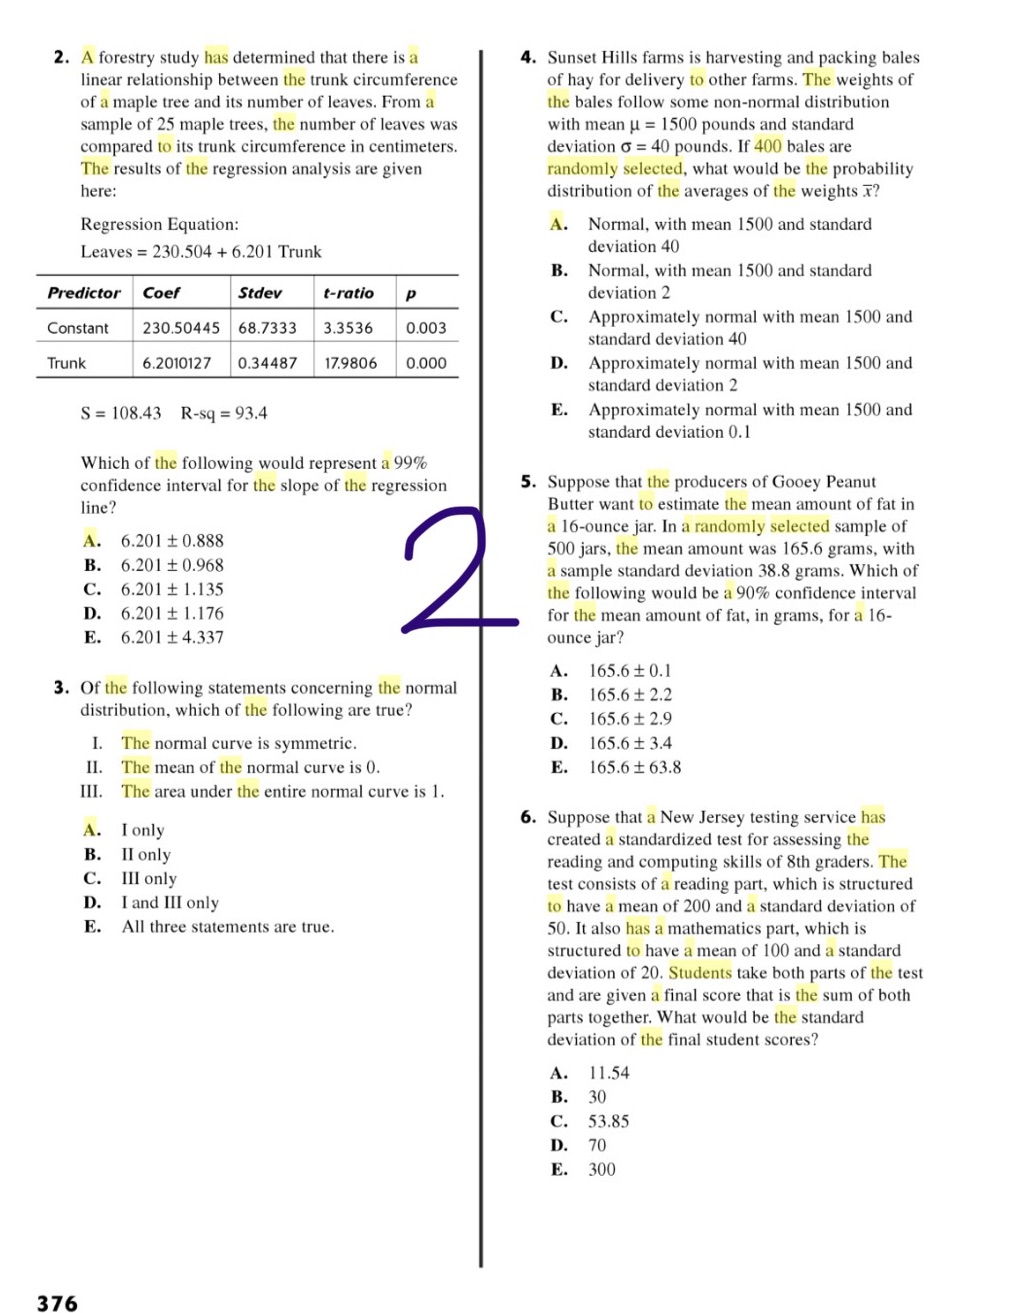
2. A forestry study has determined that there is a linear relationship between the trunk circumference of a maple tree and its number of leaves. From a sample of 25 maple trees, the number of leaves was compared 10 its trunk circumference in centimeters. The results of the regression analysis are given here: Regression Equation: Leaves = 230.504 + 6.201 Trunk Predictor Coef Stdev t-ratio P Constant 23050445 | 68.7333 | 3.3536 0.003 Trunk 6.2010127 10.34437 179806 | 0.000 376 $=10843 R-sq=934 Which of the following would represent a 99% confidence interval for the slope of the regression line? A. 0.201 0.888 B. 6.201 0.968 C. 6.201+1.135 D. 6.201x1.176 E. 6.201%4.337 Of the following statements concerning the normal distribution, which of the following are true? I. The normal curve is symmetric. II. The mean of the normal curve is (. III. The arca under the entire normal curve is 1. A. lonly B. [Ilonly C. Ilonly D. [landIII only E. All three statements are true. 4. Sunset Hills farms is harvesting and packing bales of hay for delivery to other farms. The weights of the bales follow some non-normal distribution with mean p = 1500 pounds and standard deviation = 40 pounds. If 400 bales are randomly selected, what would be the probability distribution of the averages of the weights X? A. Normal, with mean 1500 and standard deviation 40 B. Normal, with mean 1500 and standard deviation 2 C. Approximately normal with mean 1500 and standard deviation 40 D. Approximately normal with mean 1500 and standard deviation 2 E. Approximately normal with mean 1500 and standard deviation 0.1 Suppose that the producers of Gooey Peanut Butter want to estimate the mean amount of fat in a 16-ounce jar. In a randomly selected sample of 500 jars, the mean amount was 165.6 grams, with a sample standard deviation 38.8 grams, Which of the following would be a 90% confidence interval for the mean amount of fat, in grams, for a 16- ounce jar? A. 165.6%0.] B. 1656+22 C. 1656+29 D. 1656t34 E. 1656+63.8 Suppose that a New Jersey testing service has created a standardized test for assessing the reading and computing skills of 8th graders. The test consists of a reading part, which is structured to have a mean of 200 and a standard deviation of 50. It also has a mathematics part, which is structured to have a mean of 100 and a standard deviation of 20. Students take both parts of the test and are given a final score that is the sum of both parts together. What would be the standard deviation of the final student scores? A, 1154 B. 30 C. 5385 D. 70 E. 300
Step by Step Solution
There are 3 Steps involved in it

Get step-by-step solutions from verified subject matter experts