

Question: What are the box and whisker plot telling you about self employment. like can you explain what is going on. also what is the histogram
What are the box and whisker plot telling you about self employment. like can you explain what is going on. also what is the histogram telling you? like can you also explain what is going on?
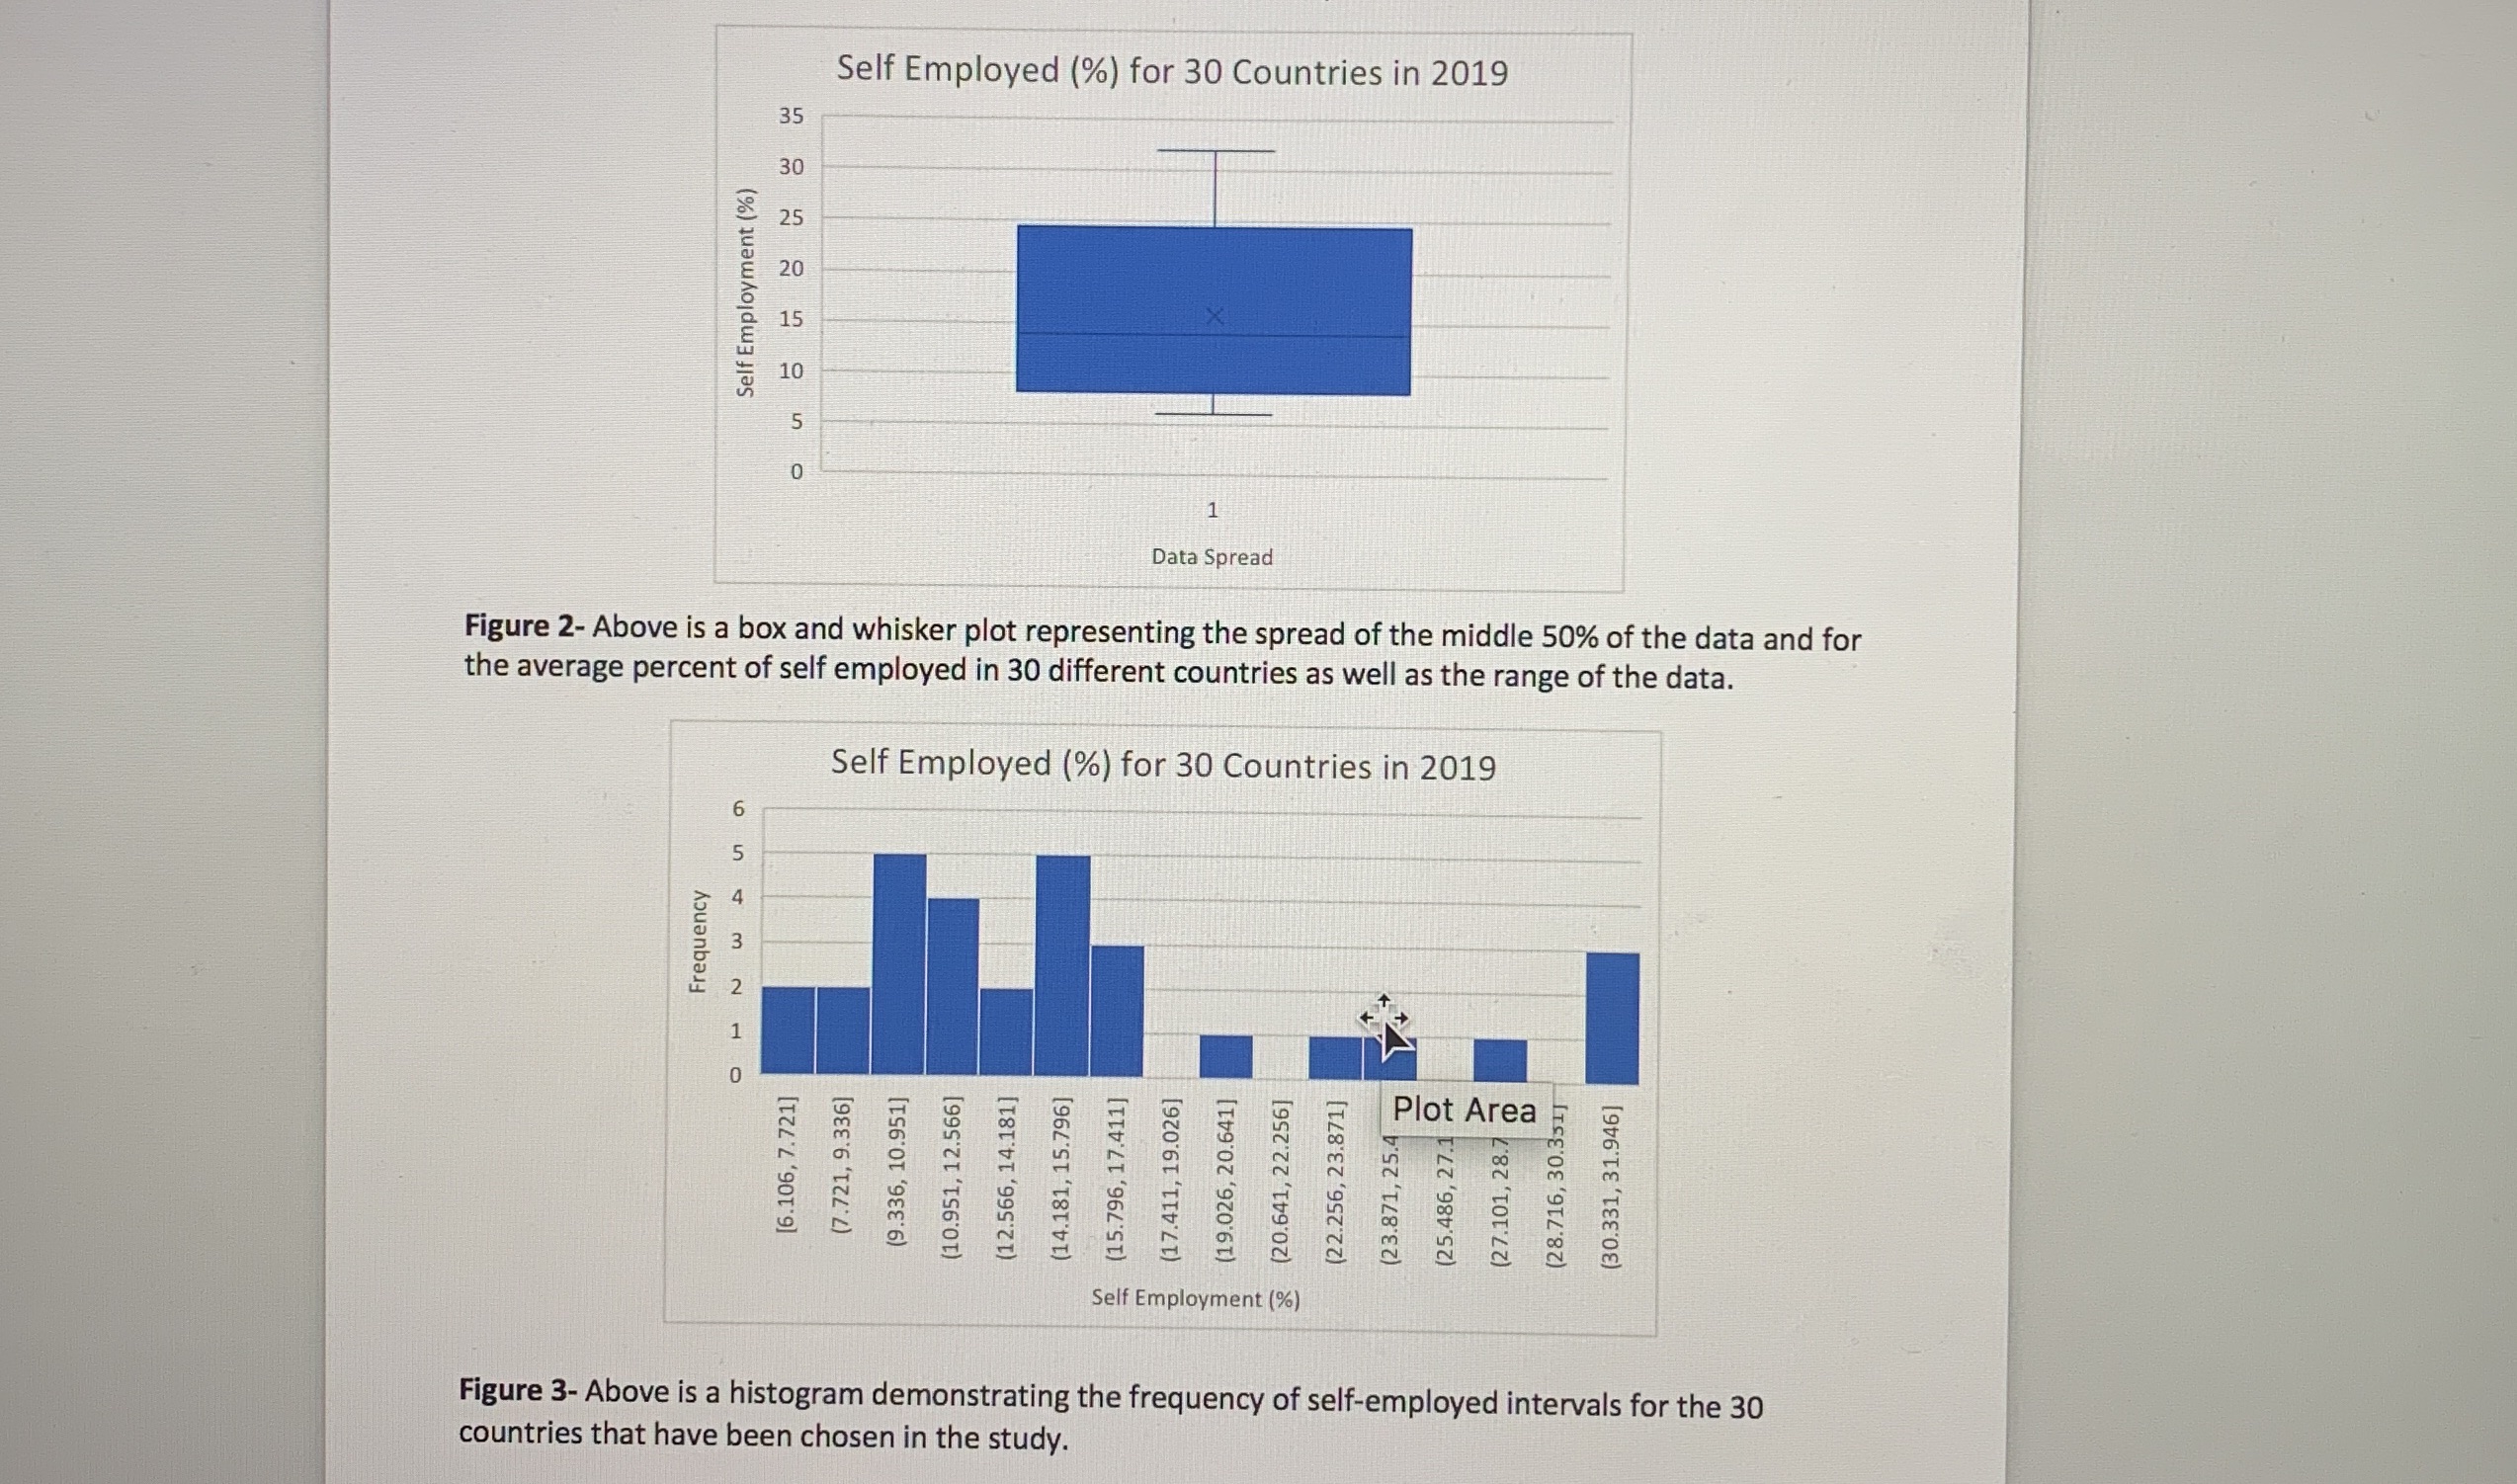
countries that have been chosen in the study. Figure 3- Above is a histogram demonstrating the frequency of self-employed intervals for the 30 Frequency NW AUTO Self Employment (% [6.106, 7.721] 10 15 20 25 30 35 (7.721, 9.336] (9.336, 10.951] (10.951, 12.566] (12.566, 14.181] (14.181, 15.796] Self Employment (%) (15.796, 17.411] (17.411, 19.026] (19.026, 20.641] Data Spread (20.641, 22.256] (22.256, 23.871] (23.871, 25.4 (25.486, 27.1 (27.101, 28. Plot Area Self Employed (%) for 30 Countries in 2019 Self Employed (%) for 30 Countries in 2019 (28.716, 30.351] (30.331, 31.946] the average percent of self employed in 30 different countries as well as the range of the data. Figure 2- Above is a box and whisker plot representing the spread of the middle 50% of the data and for
Step by Step Solution
There are 3 Steps involved in it

Get step-by-step solutions from verified subject matter experts