

Question: What are the steps to answer part one in excel and the regression equation? How do I set up the problem to answer questions 2
What are the steps to answer part one in excel and the regression equation? How do I set up the problem to answer questions 2 and 3?
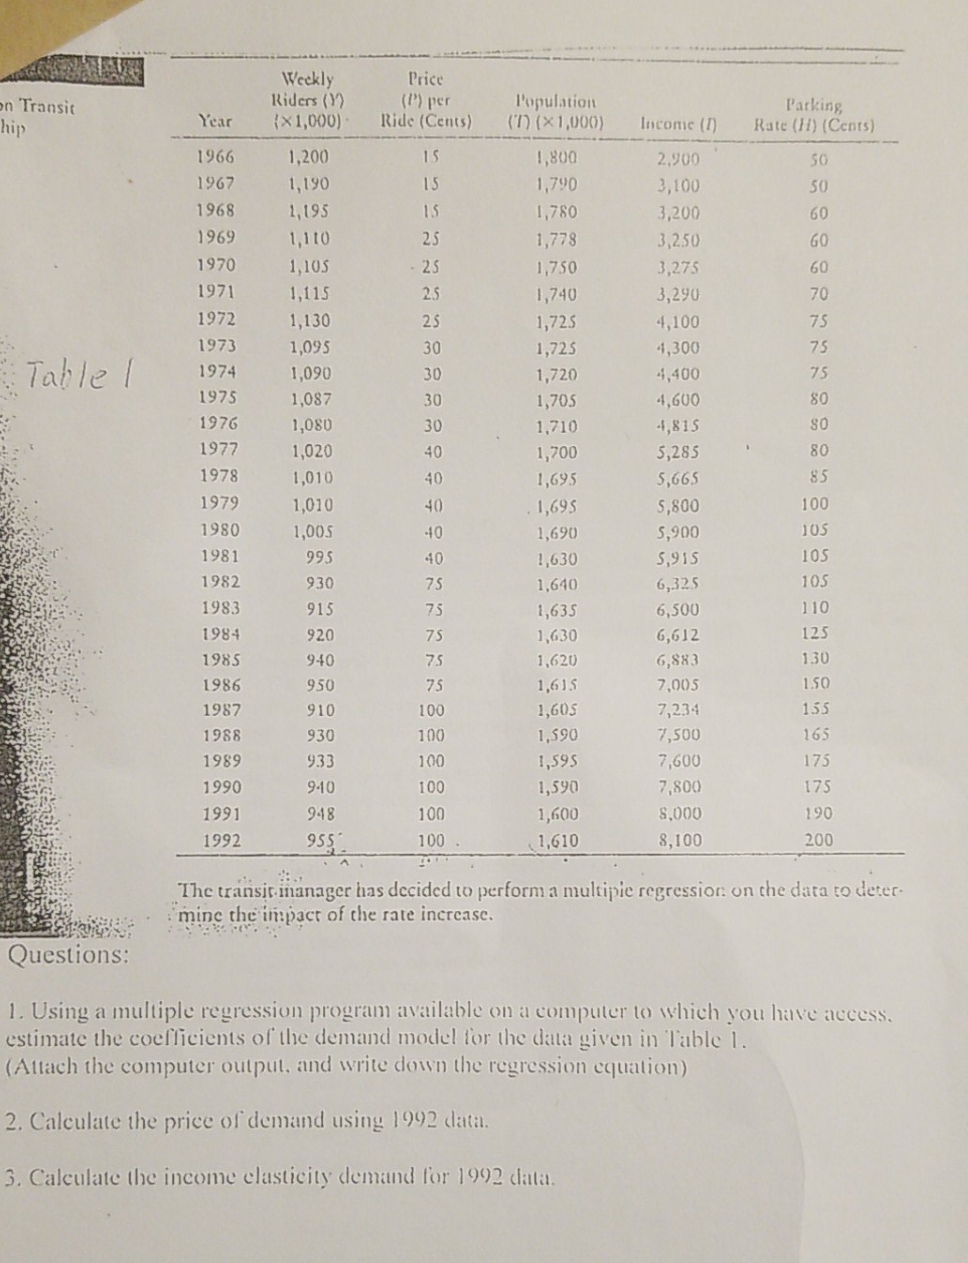
Weekly on Transit Price hip Year Riders (1) (x 1,000) (P) per Ride (Cents) Population ('n) (x1,000) Parking 1966 Income (1) 1,200 Rate (H) (Cents) 15 1967 1, 190 1,800 2,900 15 1968 1, 195 1,790 3,100 1,110 1,780 50 1969 25 3,200 60 1970 1,105 1,779 3,250 1971 25 GO 1,115 1,750 25 3,275 60 1972 1,130 1,740 25 3,290 70 1973 1,095 1,725 1974 30 4,100 75 Table / 1,090 1,725 4,300 75 1975 30 1,087 1,720 1976 30 4,400 75 1,080 1,70s 1977 30 4,600 80 1,020 1,710 4,815 80 40 1978 1,010 1,700 5,285 80 40 1979 1,010 1,695 5,665 85 40 1980 1,005 1,695 40 5,800 100 1981 995 1,690 40 5,900 105 1982 930 1,630 1983 75 5,915 105 915 1,640 6,325 75 105 1984 920 1,635 6,500 75 1 10 1985 940 1,630 75 6,612 125 1986 950 1,620 6,883 75 130 1987 910 1,615 7,005 100 1.50 1988 930 1,605 7,234 100 155 1989 1,590 933 7,500 100 165 1990 1,595 9-10 7,600 100 175 1991 1,590 948 7,800 100 175 1992 955 1,600 8,000 100 190 1,610 8,100 200 The transit manager has decided to perform a multiple regression on the data to deter- : mine the impact of the rate increase. Questions: 1. Using a multiple regression program available on a computer to which you have access. estimate the coefficients of the demand model for the data given in Table 1. (Attach the computer output. and write down the regression equation) 2. Calculate the price of demand using 1992 data. 3. Calculate the income elasticity demand for 1992 data
Step by Step Solution
There are 3 Steps involved in it

Get step-by-step solutions from verified subject matter experts