

Question: What can you conclude from the data on my experiment? I need help understanding! Data Table - Experiment P09 Data Table 1 Standing Waves on
What can you conclude from the data on my experiment? I need help understanding!
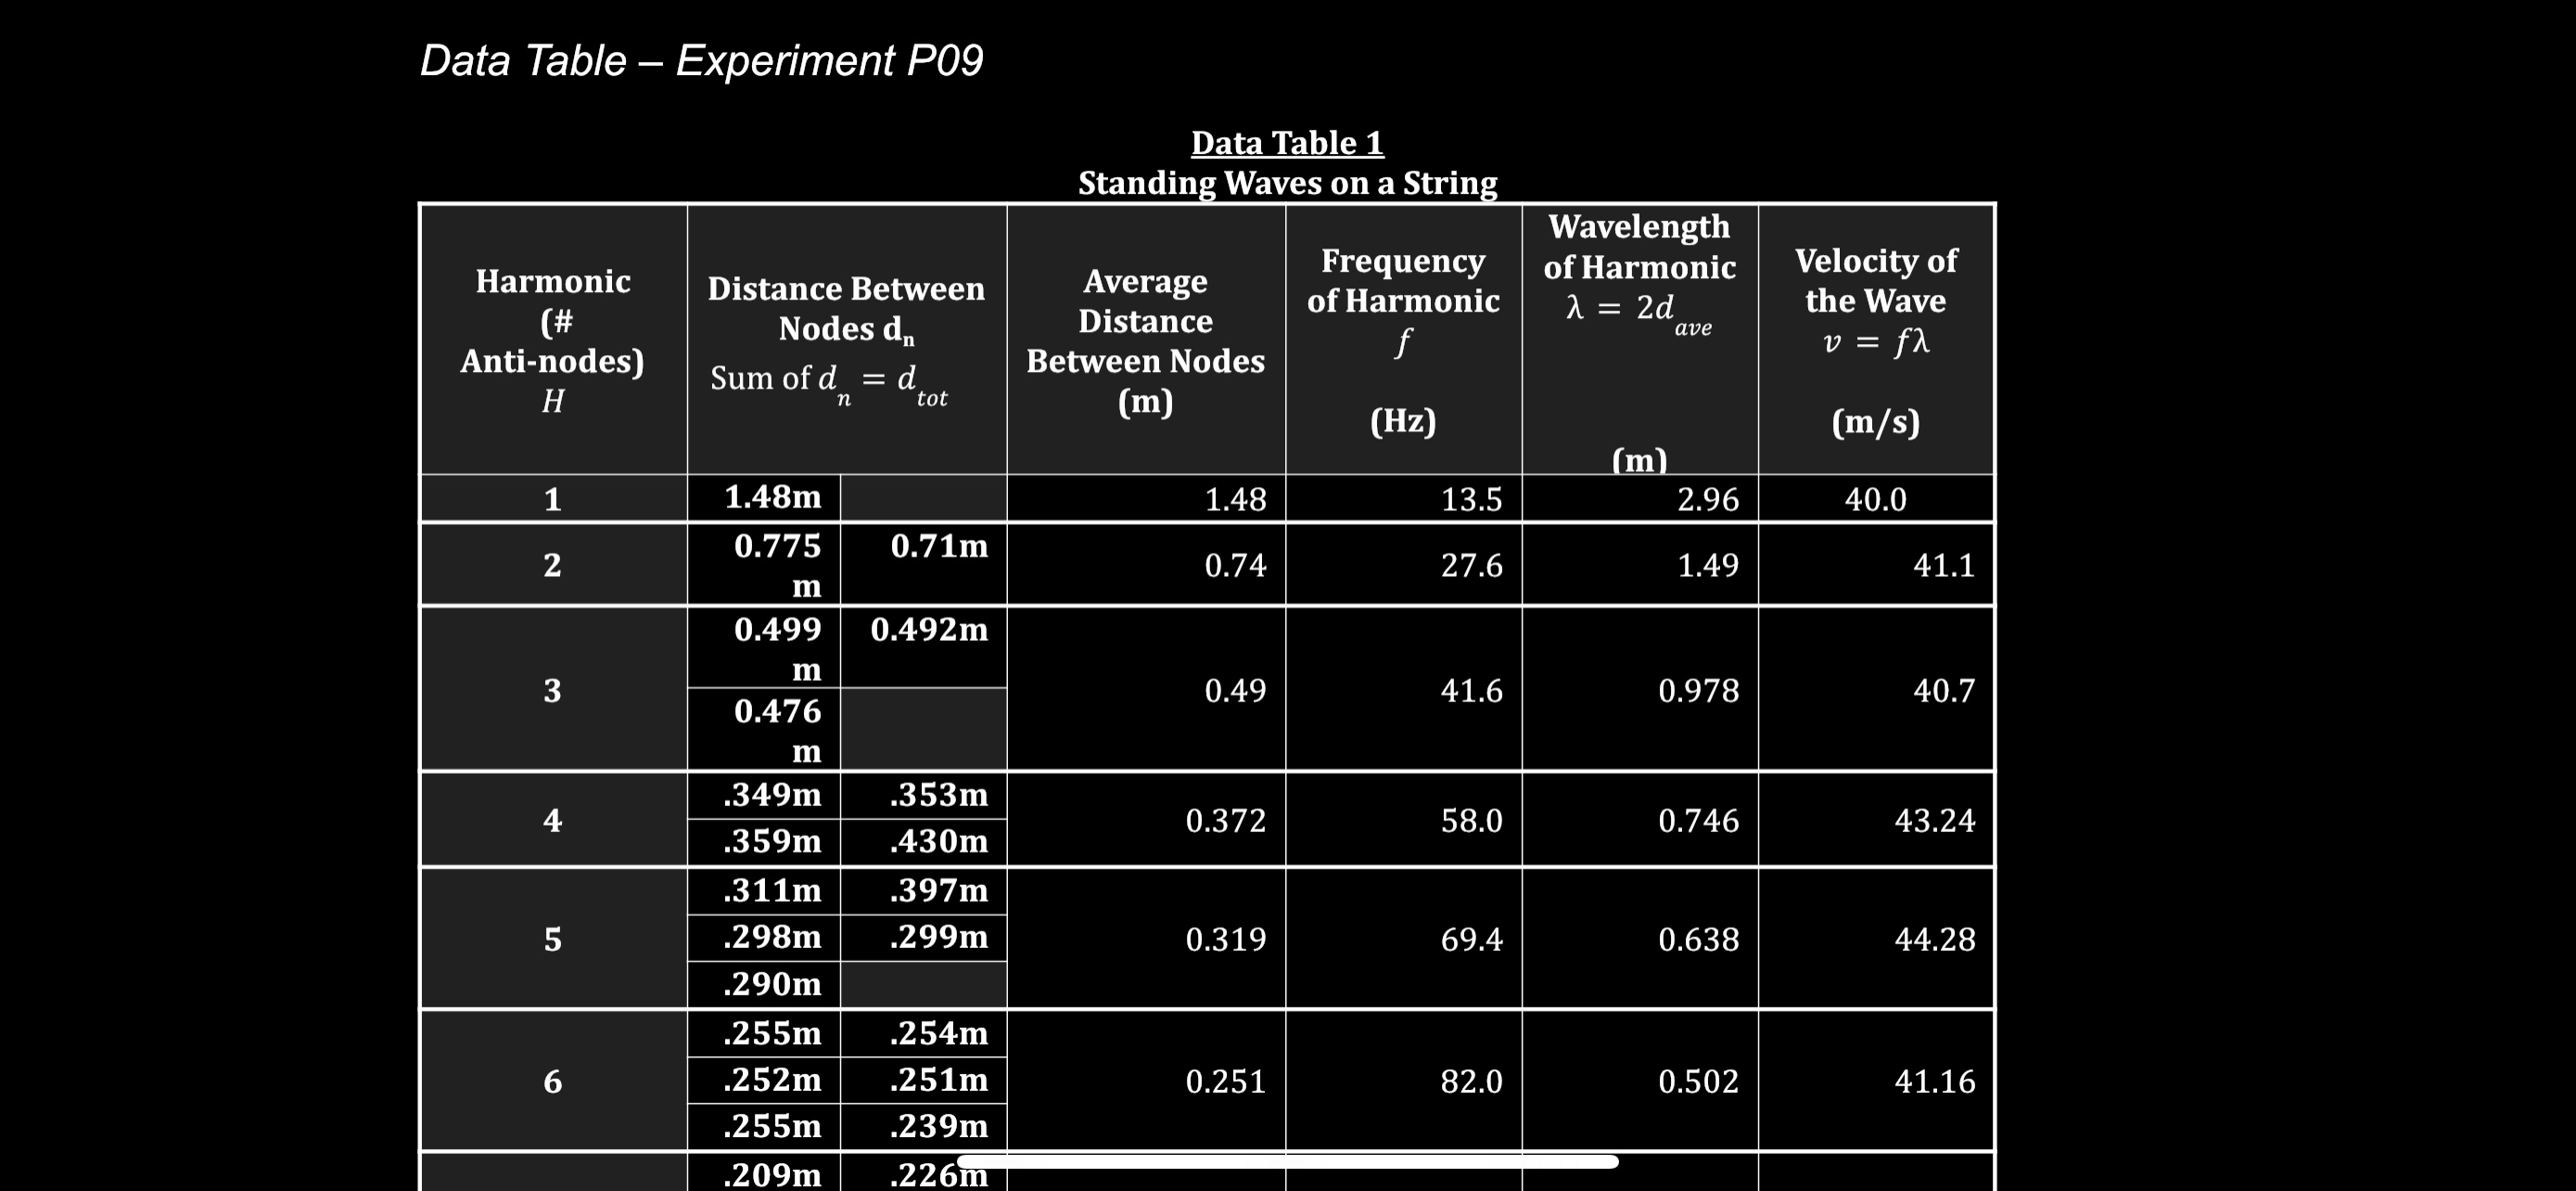
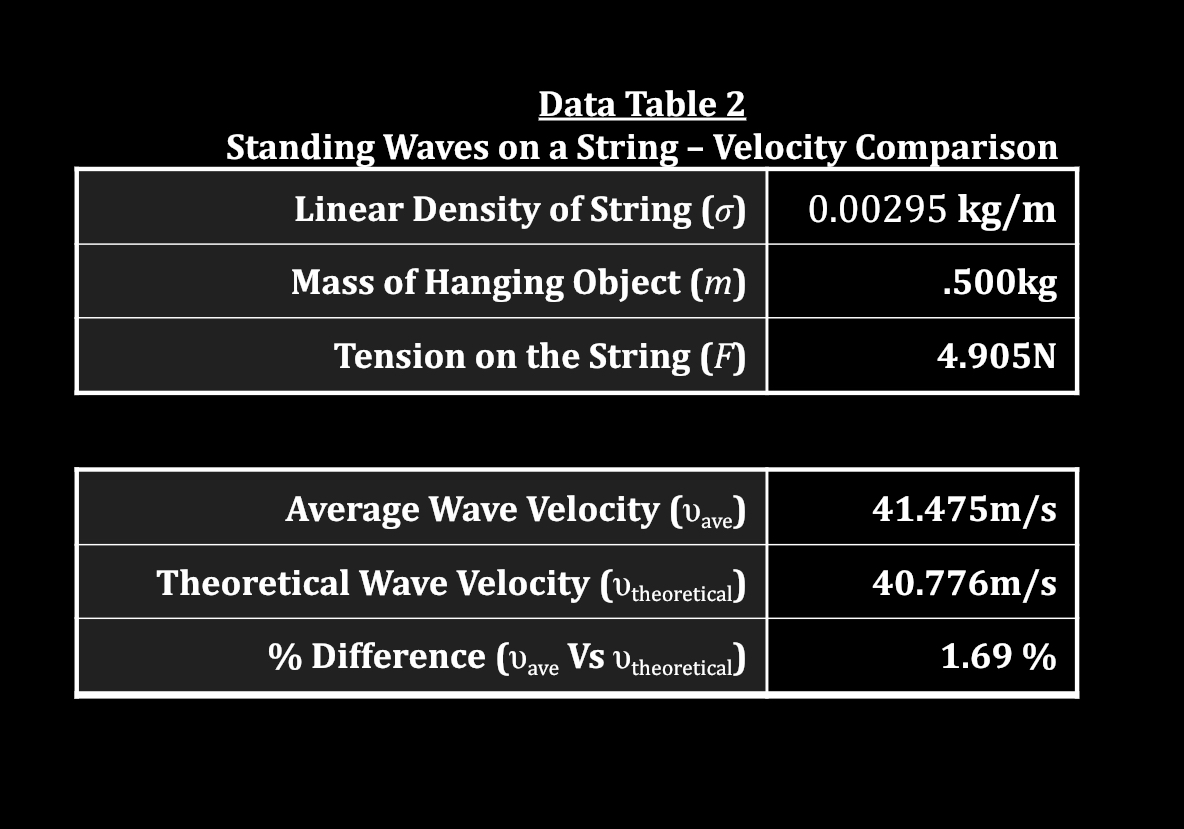
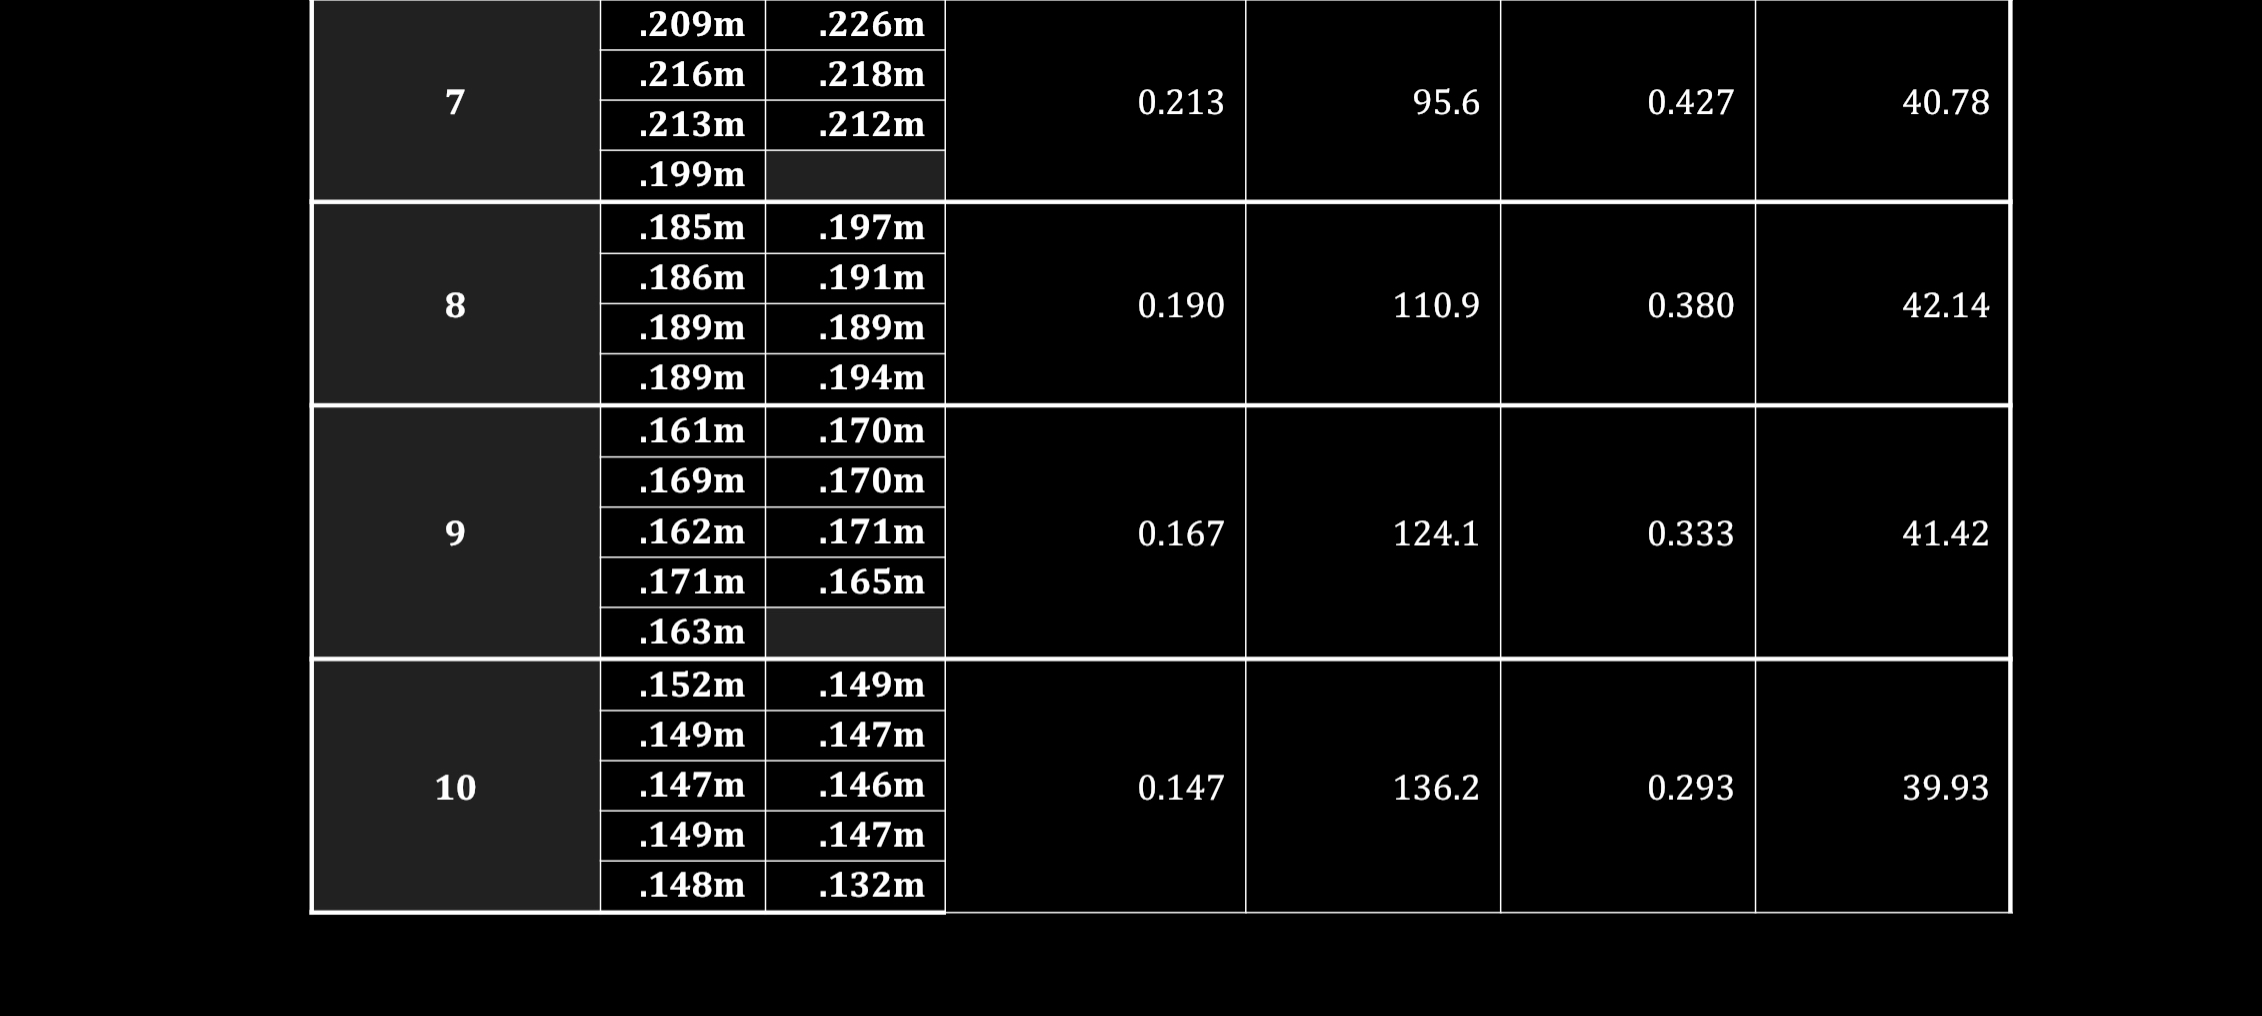
Data Table - Experiment P09 Data Table 1 Standing Waves on a String Wavelength Velocity of Harmonic Average Frequency of Harmonic Distance Between of Harmonic the Wave (# Distance 2 = 2d Nodes dn ave v = fx Anti-nodes) Sum of d = d Between Nodes H tot (m) (Hz) (m/s) (m) 1.48m 1.48 13.5 2.96 40.0 0.775 0.71m 2 0.74 27.6 1.49 41.1 m 0.499 0.492m m 3 0.49 41.6 0.978 40.7 0.476 m .349m 353m 4 0.372 58.0 0.746 43.24 .359m 430m .311m 397m 5 298m 299m 0.319 69.4 0.638 44.28 290m .255m .254m 6 252m .251m 0.251 82.0 0.502 41.16 255m 239m 209m 226mData Table 2 Standing Waves on a String - Velocity Comparison Linear Density of String (o) 0.00295 kg/m Mass of Hanging Object (m) .500kg Tension on the String (F) 4.905N Average Wave Velocity (ave) 41.475m/s Theoretical Wave Velocity (Vtheoretical) 40.776m/s % Difference (ave VS Utheoretical) 1.69 %\f
Step by Step Solution
There are 3 Steps involved in it

Get step-by-step solutions from verified subject matter experts