

Question: What concept does the following graph illustrate? Expected return 24 D1 DO 22 u 0=1 20 18 00 10 Standard deviation of portfolio 20 30
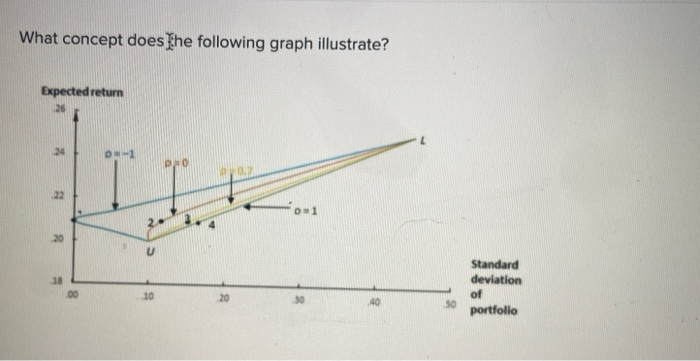

What concept does the following graph illustrate? Expected return 24 D1 DO 22 u 0=1 20 18 00 10 Standard deviation of portfolio 20 30 50 Multiple Choice Systematic risk sets. Opportunity Sets. Opportunity costs CAPM Unsystematic risk sets
Step by Step Solution
There are 3 Steps involved in it
1 Expert Approved Answer
Step: 1 Unlock

Question Has Been Solved by an Expert!
Get step-by-step solutions from verified subject matter experts
Step: 2 Unlock
Step: 3 Unlock