

Question: Use the accompanying data table regarding retirement funds. a. Construct a table that tabulates market cap, risk, and rating. b. What conclusions can you
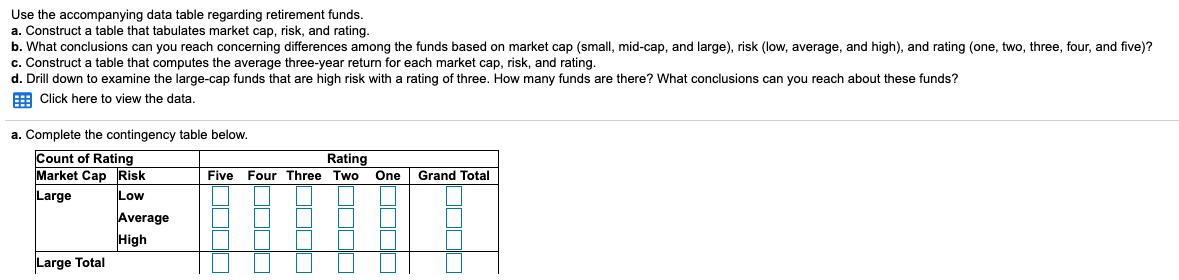
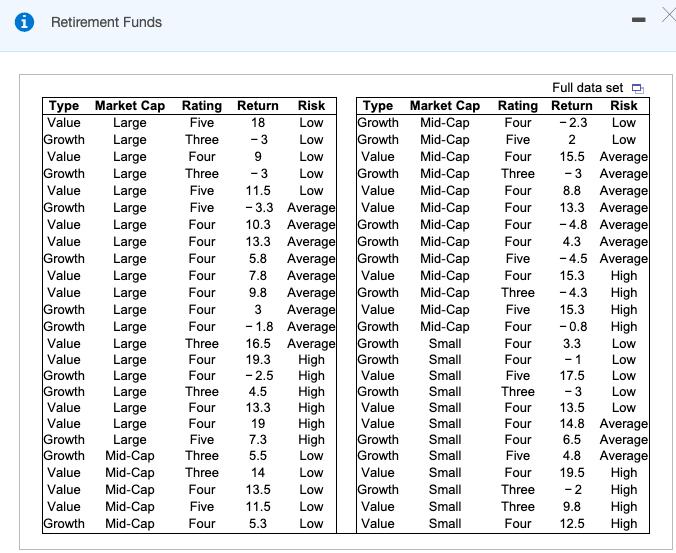
Use the accompanying data table regarding retirement funds. a. Construct a table that tabulates market cap, risk, and rating. b. What conclusions can you reach concerning differences among the funds based on market cap (small, mid-cap, and large), risk (low, average, and high), and rating (one, two, three, four, and five)? c. Construct a table that computes the average three-year return for each market cap, risk, and rating. d. Drill down to examine the large-cap funds that are high risk with a rating of three. How many funds are there? What conclusions can you reach about these funds? E Click here to view the data. a. Complete the contingency table below. Count of Rating Market Cap Risk Rating Five Four Three Two One Grand Total Large Low Average High Large Total Retirement Funds Full data set Type Market Cap Rating Return Large Large Large Large Large Large Large Large Large Large Large Large Large Large Large Large Large Large Large Large Mid-Cap Mid-Cap Mid-Cap Mid-Cap Mid-Cap Risk Type Market Cap Rating Return Mid-Cap Mid-Cap Mid-Cap Mid-Cap Mid-Cap Mid-Cap Mid-Cap Mid-Cap Mid-Cap Mid-Cap Mid-Cap Mid-Cap Mid-Cap Small Small Small Small Small Risk Four Growth Growth Value Five 18 Low -2.3 Low Growth Three - 3 Low Five 2 Low 15.5 Average Average Average 13.3 Average - 4.8 Average Average - 4.5 Average High High High High Value Four Low Value Four Growth Three - 3 Low Growth Three - 3 Value Five 11.5 Low Value Four 8.8 - 3.3 Average 10.3 Average 13.3 Average Average Average Average Average - 1.8 Average 16.5 Average High High High High High High Low Growth Five Value Four Growth Growth Growth Value Four Four Value Four Four 4.3 Growth Four 5.8 Five Value Four 7.8 Value Four 15.3 Growth Value Growth Growth Four 9.8 Three - 4.3 Four 3 Value Five 15.3 Growth Growth Growth Four Four - 0.8 Value Three Four 3.3 Low Value Growth Growth Four 19.3 Four - 1 Low Four Three - 2.5 Value Five 17.5 Low 4.5 Growth Three - 3 Low Four Four Five Three Value 13.3 Value Four 13.5 Low 14.8 Average Average Average High High High High Value 19 Value Small Four Growth Growth Growth Growth Small Small 7.3 Four 6.5 5.5 Five 4.8 Value Three 14 Low Value Small Four 19.5 Value Four 13.5 Low Growth Small Three -2 Value Five 11.5 Low Value Small Three 9.8 Growth Four 5.3 Low Value Small Four 12.5
Step by Step Solution
3.47 Rating (173 Votes )
There are 3 Steps involved in it
midup Ang Mideal Midcal midcop Mideap Midcep 3Aug Audeep Aug and cop 5 Aug Mideap 3 ... View full answer

Get step-by-step solutions from verified subject matter experts