

Question: What data should be plotted to show that experimental concentration data fits a second-order reaction? A) ln(k) vs. 1/T B) [reactant] vis time. C) 1/(reactant)
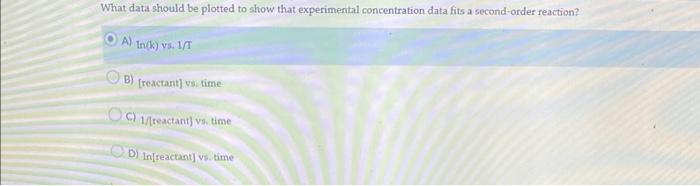
What data should be plotted to show that experimental concentration data fits a second-order reaction? A) ln(k) vs. 1/T B) [reactant] vis time. C) 1/(reactant) vis time D) In[reactant] vs. time
Step by Step Solution
There are 3 Steps involved in it
1 Expert Approved Answer
Step: 1 Unlock

Question Has Been Solved by an Expert!
Get step-by-step solutions from verified subject matter experts
Step: 2 Unlock
Step: 3 Unlock