

Question: What data visualizations are provided in the report? How do the data visualizations help convey information that is both useful and easy to understand? Explain
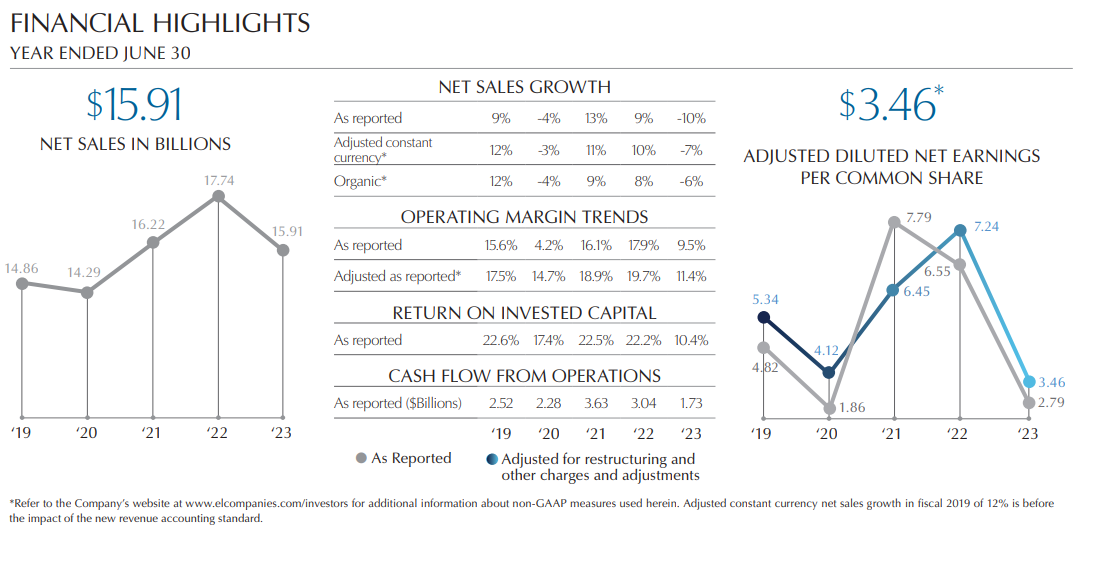
What data visualizations are provided in the report? How do the data visualizations help convey information that is both useful and easy to understand? Explain how the report is organized. Does it start with a general introductory paragraph? Does it pull the reader in with a surprising bit of news? How is the report divided up What ideas about structure might you adopt for your report?FINANCIAL HIGHLIGHTS
YEAR ENDED JUNE
NET SALES IN BILLIONS
NET SALES GROWTH
OPERATING MARGIN TRENDS
RETURN ON INVESTED CAPITAL
CASH FLOW FROM OPERATIONS
ADJUSTED DILUTED NET EARNINGS
PER COMMON SHARE
the impact of the new revenue accounting standard.
Step by Step Solution
There are 3 Steps involved in it
1 Expert Approved Answer
Step: 1 Unlock

Question Has Been Solved by an Expert!
Get step-by-step solutions from verified subject matter experts
Step: 2 Unlock
Step: 3 Unlock