Question: What data visualizations are provided in the report? How do the data visualizations help convey information that is both useful and easy to understand? Performance

What data visualizations are provided in the report? How do the data visualizations help convey information that is both useful and easy to understand? What data visualizations are provided in the
Performance Highlights 5 Year CAGR Sales Diluted Net Earnings Per Common Share $6.00 10% 9% 8% 796 6% $5.00 5 $4.00 53.00 4% 396 2% 196 096 $2.00 The Este Lauder Companies Inc Global Prestige Beauty S&P 500 Consumer Staples Index $1.00 FY 2016 FY 2017 FY 2018 FY 2019 FY 2020 As reported Adjusted for restructuring and other charges and adjustments 2019 THE ESTEE LAUDER COMPANIES AVERAGE ANNUAL NET SALES GROWTH CONSTANT CURRENCY FOR FISCAL YEARS 2015-2020 GLOBAL PRESTIGE BEAUTY AVERAGE ANIVUAL RETAIL SALES GROWTH IN CONSTANT CURRENCY FOR 2014- SEP 280 CONSUMER STAPLES INDEX PER FACTSET AVERAGE ANNUAL NET SALES GROWTH FOR 2014-2019 INOTE ELE DATA INCLUDES SIX MONTHS OF COVEO MPACT WE OTHERS ARE PRE-COVID CLICK HERE FOR INFORMATION ABOUT GAAR AND NON-GAAP FINANCIAL MEASURES, INCLUDING RECONCILIATION INFORMATION

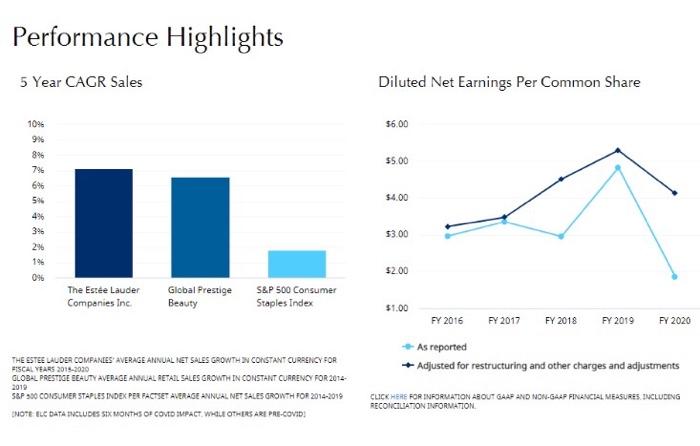
Step by Step Solution

There are 3 Steps involved in it

1 Expert Approved Answer
Step: 1 Unlock blur-text-image
Question Has Been Solved by an Expert!

Get step-by-step solutions from verified subject matter experts

Step: 2 Unlock
Step: 3 Unlock

Students Have Also Explored These Related General Management Questions!