

Question: What did I get wrong? Question 17 estion 4 What is the mean for the following set of scores: 20, 24, 26, 22. 18, 16,
What did I get wrong?
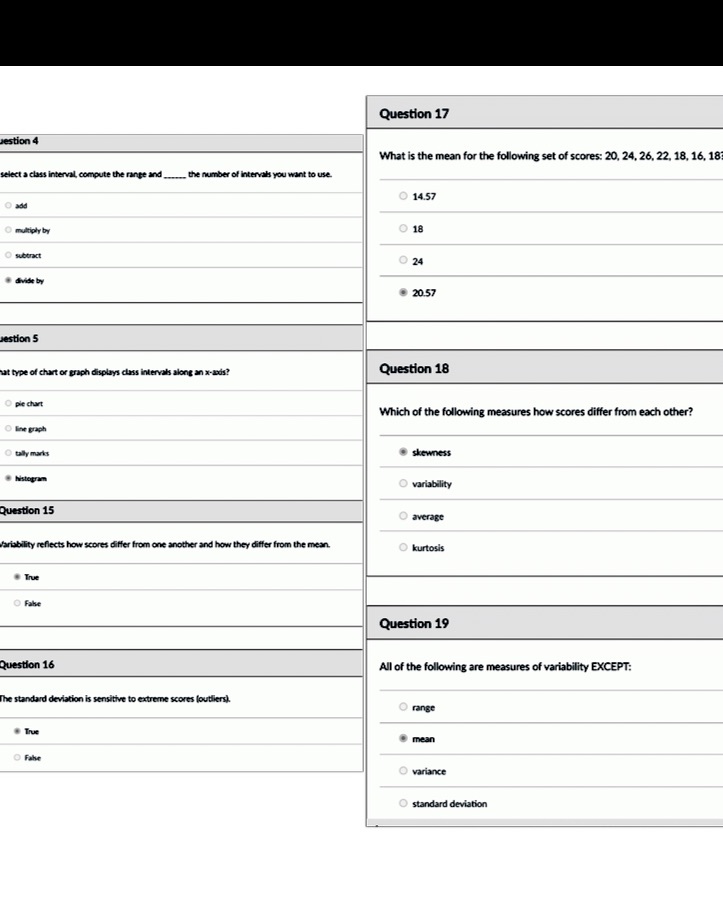
Question 17 estion 4 What is the mean for the following set of scores: 20, 24, 26, 22. 18, 16, 18 elect a class interval, compute the range and _ . the number of intervals you want to use. O 14.57 multiply by O 18 subtract O 24 divide by 20.57 estion 5 at type of chart or graph displays class intervals along an x-sods? Question 18 O ple chart Which of the following measures how scores differ from each other? OFmen graph tally marks skewness histogram O variability Question 15 O average fariability reflects how scores differ from one another and how they differ from the mean. O kurtosis True O Fake Question 19 Question 16 All of the following are measures of variability EXCEPT: The standard deviation is sensitive to extreme scores loutliers). O range True mean O Fahe O variance O standard deviation
Step by Step Solution
There are 3 Steps involved in it

Get step-by-step solutions from verified subject matter experts