

Question: What does each dot on the figure below represent? Scatter Diagram for PEP against S&P 500 Index. S&P 500 -15.00% O Ineficient portfolio O
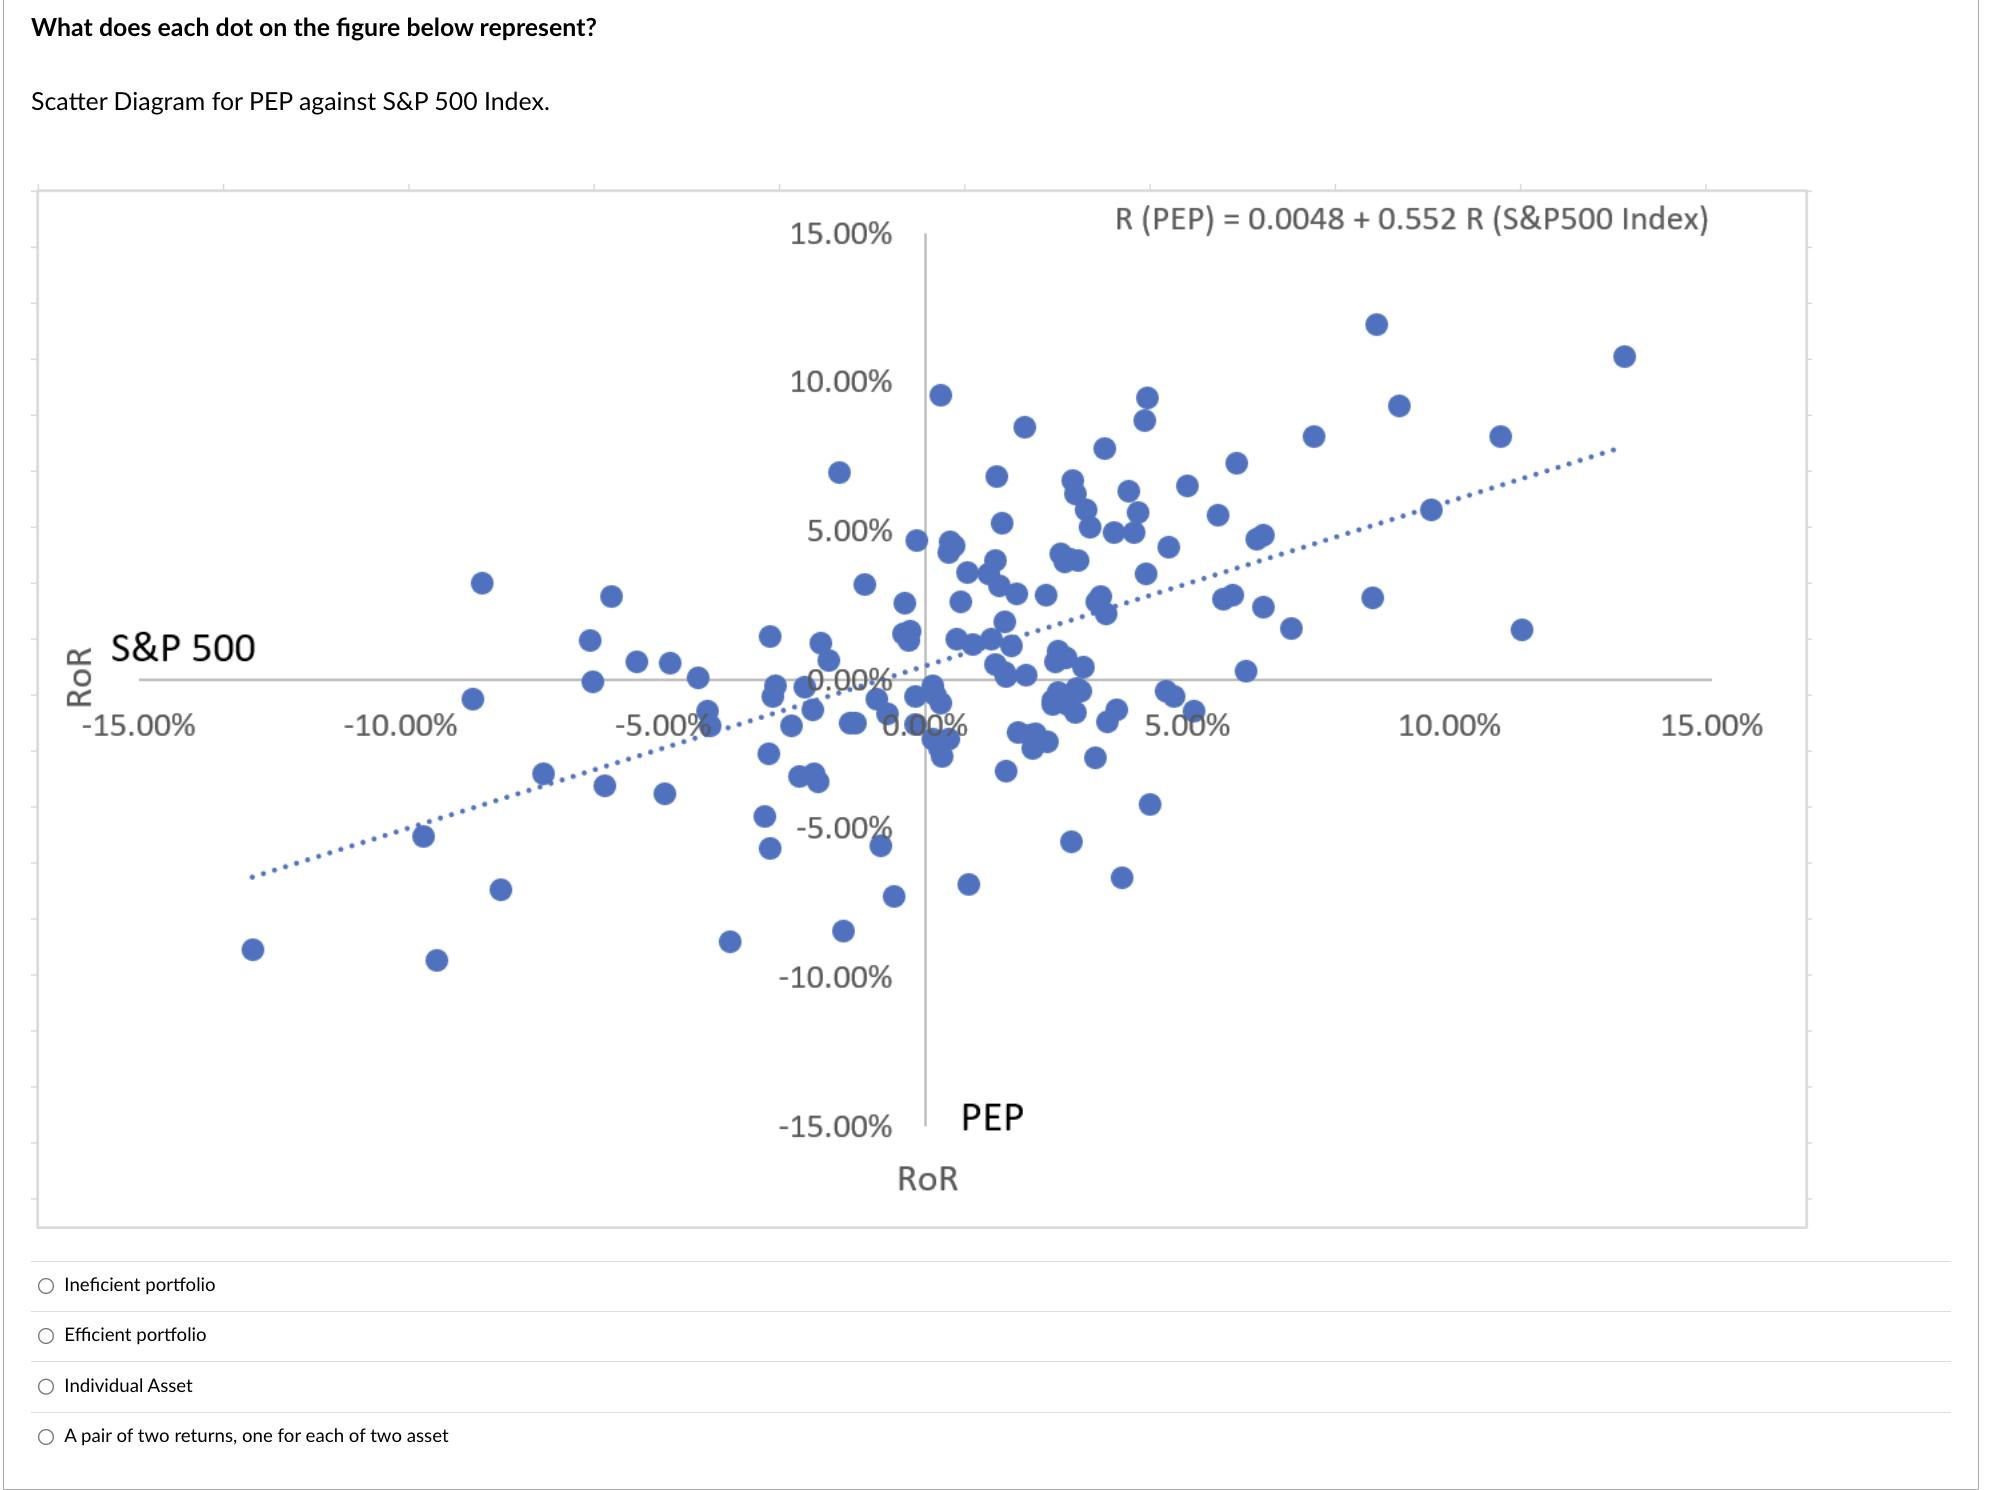
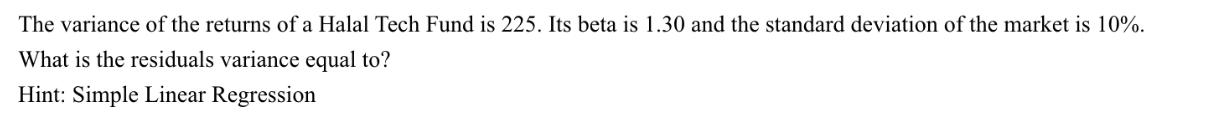
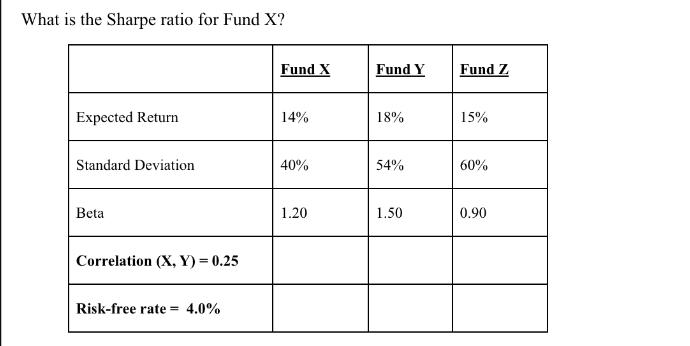
What does each dot on the figure below represent? Scatter Diagram for PEP against S&P 500 Index. S&P 500 -15.00% O Ineficient portfolio O Efficient portfolio O Individual Asset -10.00% O A pair of two returns, one for each of two asset -5.00% 15.00% 10.00% 5.00% 0.00% -5.00% -10.00% -15.00% ROR PEP R (PEP) = 0.0048 + 0.552 R (S&P500 Index) 5.00% 10.00% 15.00% The variance of the returns of a Halal Tech Fund is 225. Its beta is 1.30 and the standard deviation of the market is 10%. What is the residuals variance equal to? Hint: Simple Linear Regression What is the Sharpe ratio for Fund X? Expected Return Standard Deviation Beta Correlation (X,Y)= 0.25 Risk-free rate= 4.0% Fund X 14% 40% 1.20 Fund Y 18% 54% 1.50 Fund Z 15% 60% 0.90
Step by Step Solution
3.33 Rating (156 Votes )
There are 3 Steps involved in it

Get step-by-step solutions from verified subject matter experts