

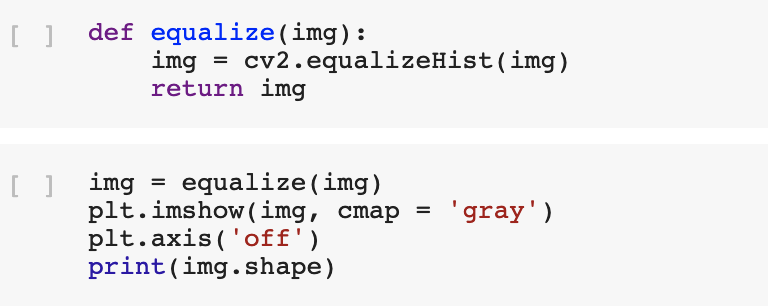
Question: What does the code above do and what does it mean in the CNN program https://colab.research.google.com/github/CleanPegasus/Traffic-Sign-Classifier/blob/master/Traffic_Sign_Classifier.ipynb#scrollTo=fMJ_3RR5HEN9 def equalize (img): 2.equalizeHist (img) return img pmt.imehua(ime (1mmap
 What does the code above do and what does it mean in the CNN program
https://colab.research.google.com/github/CleanPegasus/Traffic-Sign-Classifier/blob/master/Traffic_Sign_Classifier.ipynb#scrollTo=fMJ_3RR5HEN9
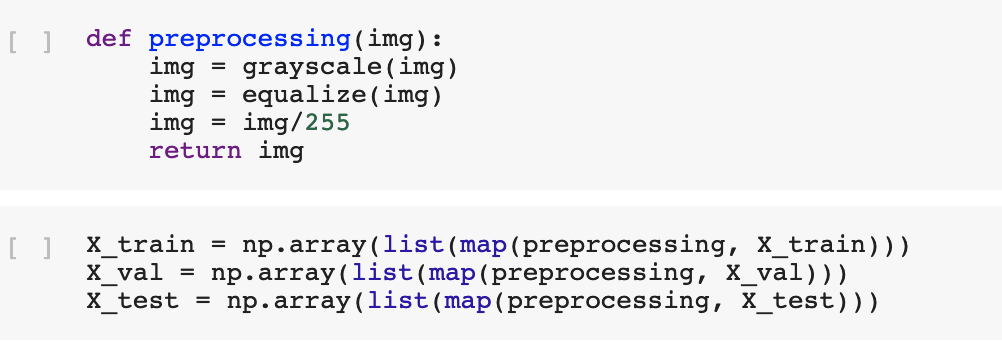
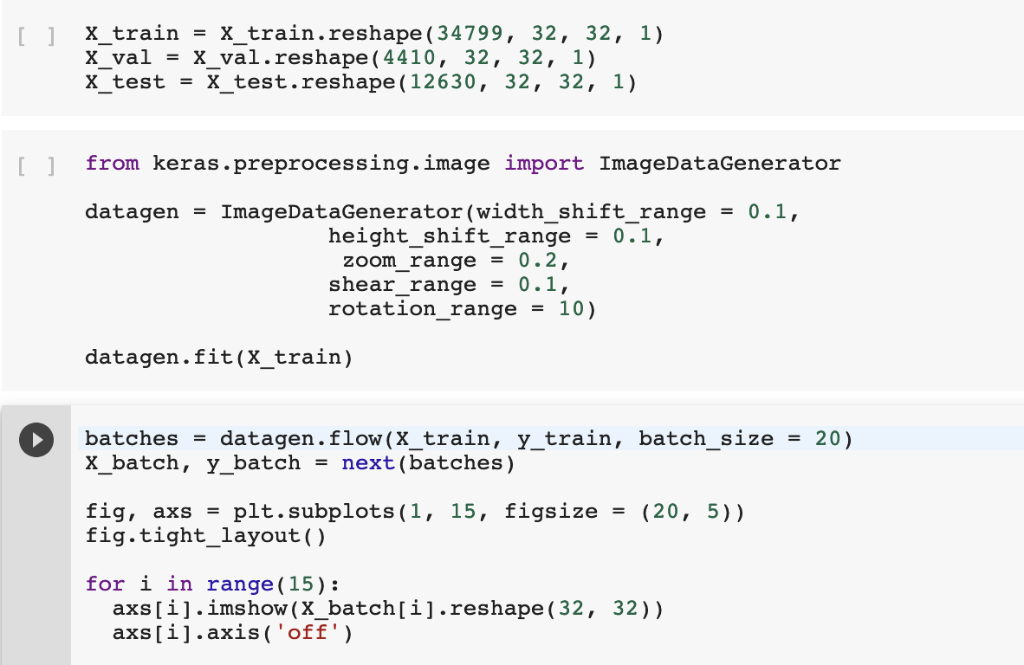
def equalize (img): 2.equalizeHist (img) return img pmt.imehua(ime (1mmap = gray. ) plt.axis 'off') print(img.shape) def preprocessing(img): ing grayscale (ing) imgequalize(img) imgimg/255 return img x train - np.array(list (map(preprocessing, X train))) x-val = np . array (11st(map (preprocessing, X-val ))) Xtest = np .array (1ist (map (preprocessing, Xtest))) [1 X_train-X train.reshape(34799, 32, 32, 1) x-val = X-val . reshape ( 4410, 32, 32, 1) X_testX test.reshape (12630, 32, 32, 1) I1 from keras.preprocessing.image import ImageDataGenerator datagen ImageDataGenerator (width. Shift-range 0.1, - = height shift range0.1. zoom range = 0.2, shear-range = 0.1, rotation-range = 10) datagen.fit(X train) batches = datagen. flow (x-train, y-train, X-batch, y-batch-next (batches) batch-size 20) = fig, axs = pit . subplots ( 1, fig.tight_layout () 15, figsize= (20, 5)) for i in range (15): axs[i].imshow(X_batch[i].reshape(32, 32)1 axs[i].axis( off') def equalize (img): 2.equalizeHist (img) return img pmt.imehua(ime (1mmap = gray. ) plt.axis 'off') print(img.shape) def preprocessing(img): ing grayscale (ing) imgequalize(img) imgimg/255 return img x train - np.array(list (map(preprocessing, X train))) x-val = np . array (11st(map (preprocessing, X-val ))) Xtest = np .array (1ist (map (preprocessing, Xtest))) [1 X_train-X train.reshape(34799, 32, 32, 1) x-val = X-val . reshape ( 4410, 32, 32, 1) X_testX test.reshape (12630, 32, 32, 1) I1 from keras.preprocessing.image import ImageDataGenerator datagen ImageDataGenerator (width. Shift-range 0.1, - = height shift range0.1. zoom range = 0.2, shear-range = 0.1, rotation-range = 10) datagen.fit(X train) batches = datagen. flow (x-train, y-train, X-batch, y-batch-next (batches) batch-size 20) = fig, axs = pit . subplots ( 1, fig.tight_layout () 15, figsize= (20, 5)) for i in range (15): axs[i].imshow(X_batch[i].reshape(32, 32)1 axs[i].axis( off')
Step by Step Solution
There are 3 Steps involved in it

Get step-by-step solutions from verified subject matter experts