

Question: What does the data in case Exhibit 1 reveal about Panera Breads financial performance? CASE 09 Panera Bread Company in 2014: Can a Slowdown in
What does the data in case Exhibit 1 reveal about Panera Breads financial performance?
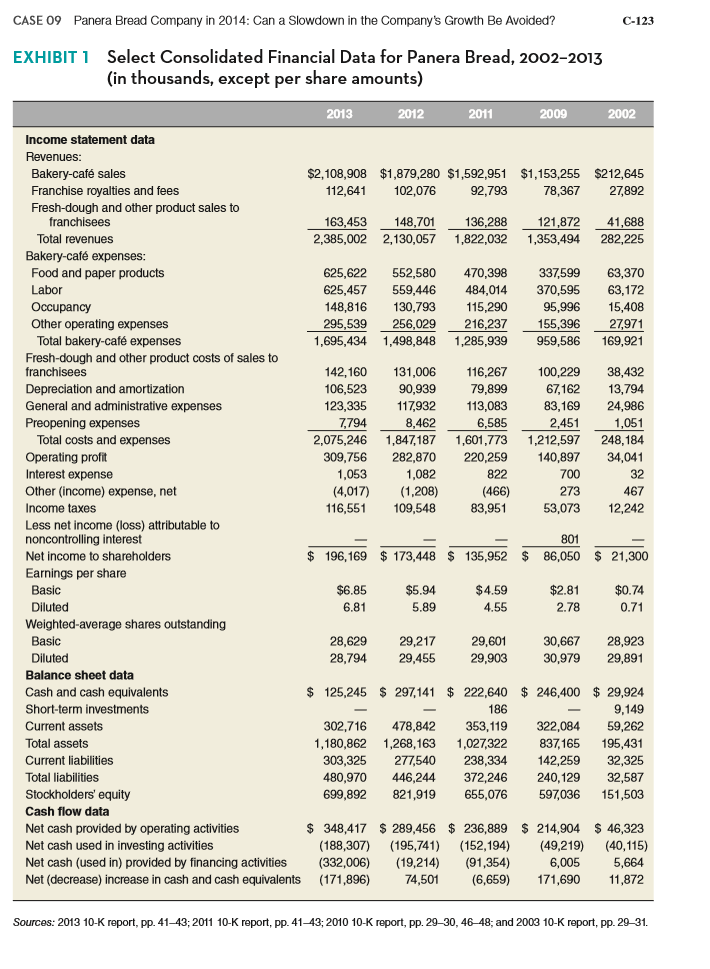
CASE 09 Panera Bread Company in 2014: Can a Slowdown in the Company's Growth Be Avoided? C-123 EXHIBIT 1 Select Consolidated Financial Data for Panera Bread, 2002-2013 (in thousands, except per share amounts) 2011 2009 Income statement data Revenues $2,108,908 $1,879,280 $1,592,951 $1,153,255 $212,645 Bakery-caf sales Franchise royalties and fees 112.641 102,076 92.793 78,367 278922 Fresh-dough and other product sales to franchisees 163,453 148.701 136.288 121,872 41,688 Total revenues 2,385,002 2,130,057 1,822,032 1,353,494. 282,225 Bakery-caf expenses Food and paper products 625,622 552,580 470,398 337599 63,370 Labor 625,457 559,446 484,014 370,595 63,172 148,816 130,793 115,290 95,996 Occupancy 15,408 Other operating expenses 295,539 256,029 216.237 155,396 27971 Total bakery-caf expenses 695,434 1,498,848 1,285,939 959,586 169,921 Fresh-dough and other product costs of sales to franchisees 142,160 131,006 116,267 100,229 38,432 Depreciation and amortization 106,523 90,939 79,899 67162 13,794 General and administrative expenses 123,335 117932 113,083 83,169 24,986 Preopening expenses 7794, 8,462 6.585 2,451 1,051 Total costs and expenses 2,075,246 1,847187 1,601,773 1,212,597 248,184 Operating profit 309,756 282,870 220,259 140,897 34,041 1,053 1.082 822 32 nterest expense (4,017) (1,208) Other (income) expense, net 466) 273 467 Income taxe 116,551 109,548 83,95 53,073 12,242 Less net income (loss) attributable to noncontrolling interest 801 Net income to shareholders 196,169 173,448 135,952 86,050 21,300 Earnings per share Basic $6.85 $5.94 $4.59 $2.8 $0.74 Diluted 6.81 5.89 4.55 2.78 0.71 Weighted-average shares outstanding Basic 30,667 28,923 Diluted 30,979 29,891 Balance sheet data 125,245 297, 141 222,640 6,400 29,924 Cash and cash equivalents Short-term investments 186 9,149 Current assets 302,716 478,842 353,119 322,084. 59,262 Total assets 1,180,862 1,268,163 1.027322 837165 195,431 Current liabilitie 303.325 277540 238,334. 142,259 32,325 Total liabilities 480,970 446.244 372,246 240,129 32,587 Stockholders' equity 699,892 821,919 655.076 597036 151,503 Cash flow data Net cash provided by operating activities 348,417 289,456 236,889 214,904 46,323 Net cash used in investing activities 188,307) (195,741 (152,194) (49,219) 40,115) Net cash (used in) provided by financing activities (332,006) (19,214 91,354) 6,005 5,664 Net (decrease) increase in cash and cash equivalents (171,896) 74,501 (6,659) 171,690 11,872 Sources: 2013 10-K report, pp. 41-43; 201 0-K report, pp. 41-43, 2010 10-K report, pp. 29-30, 46-48; and 2003 10-K report, pp. 29-3
Step by Step Solution
There are 3 Steps involved in it

Get step-by-step solutions from verified subject matter experts