

Question: What does the graph demonstrate? In writing Maps Prompt Untitled docume... Express VPN Use descriptions of shape, center, and spread to compare the distribution of
What does the graph demonstrate? In writing
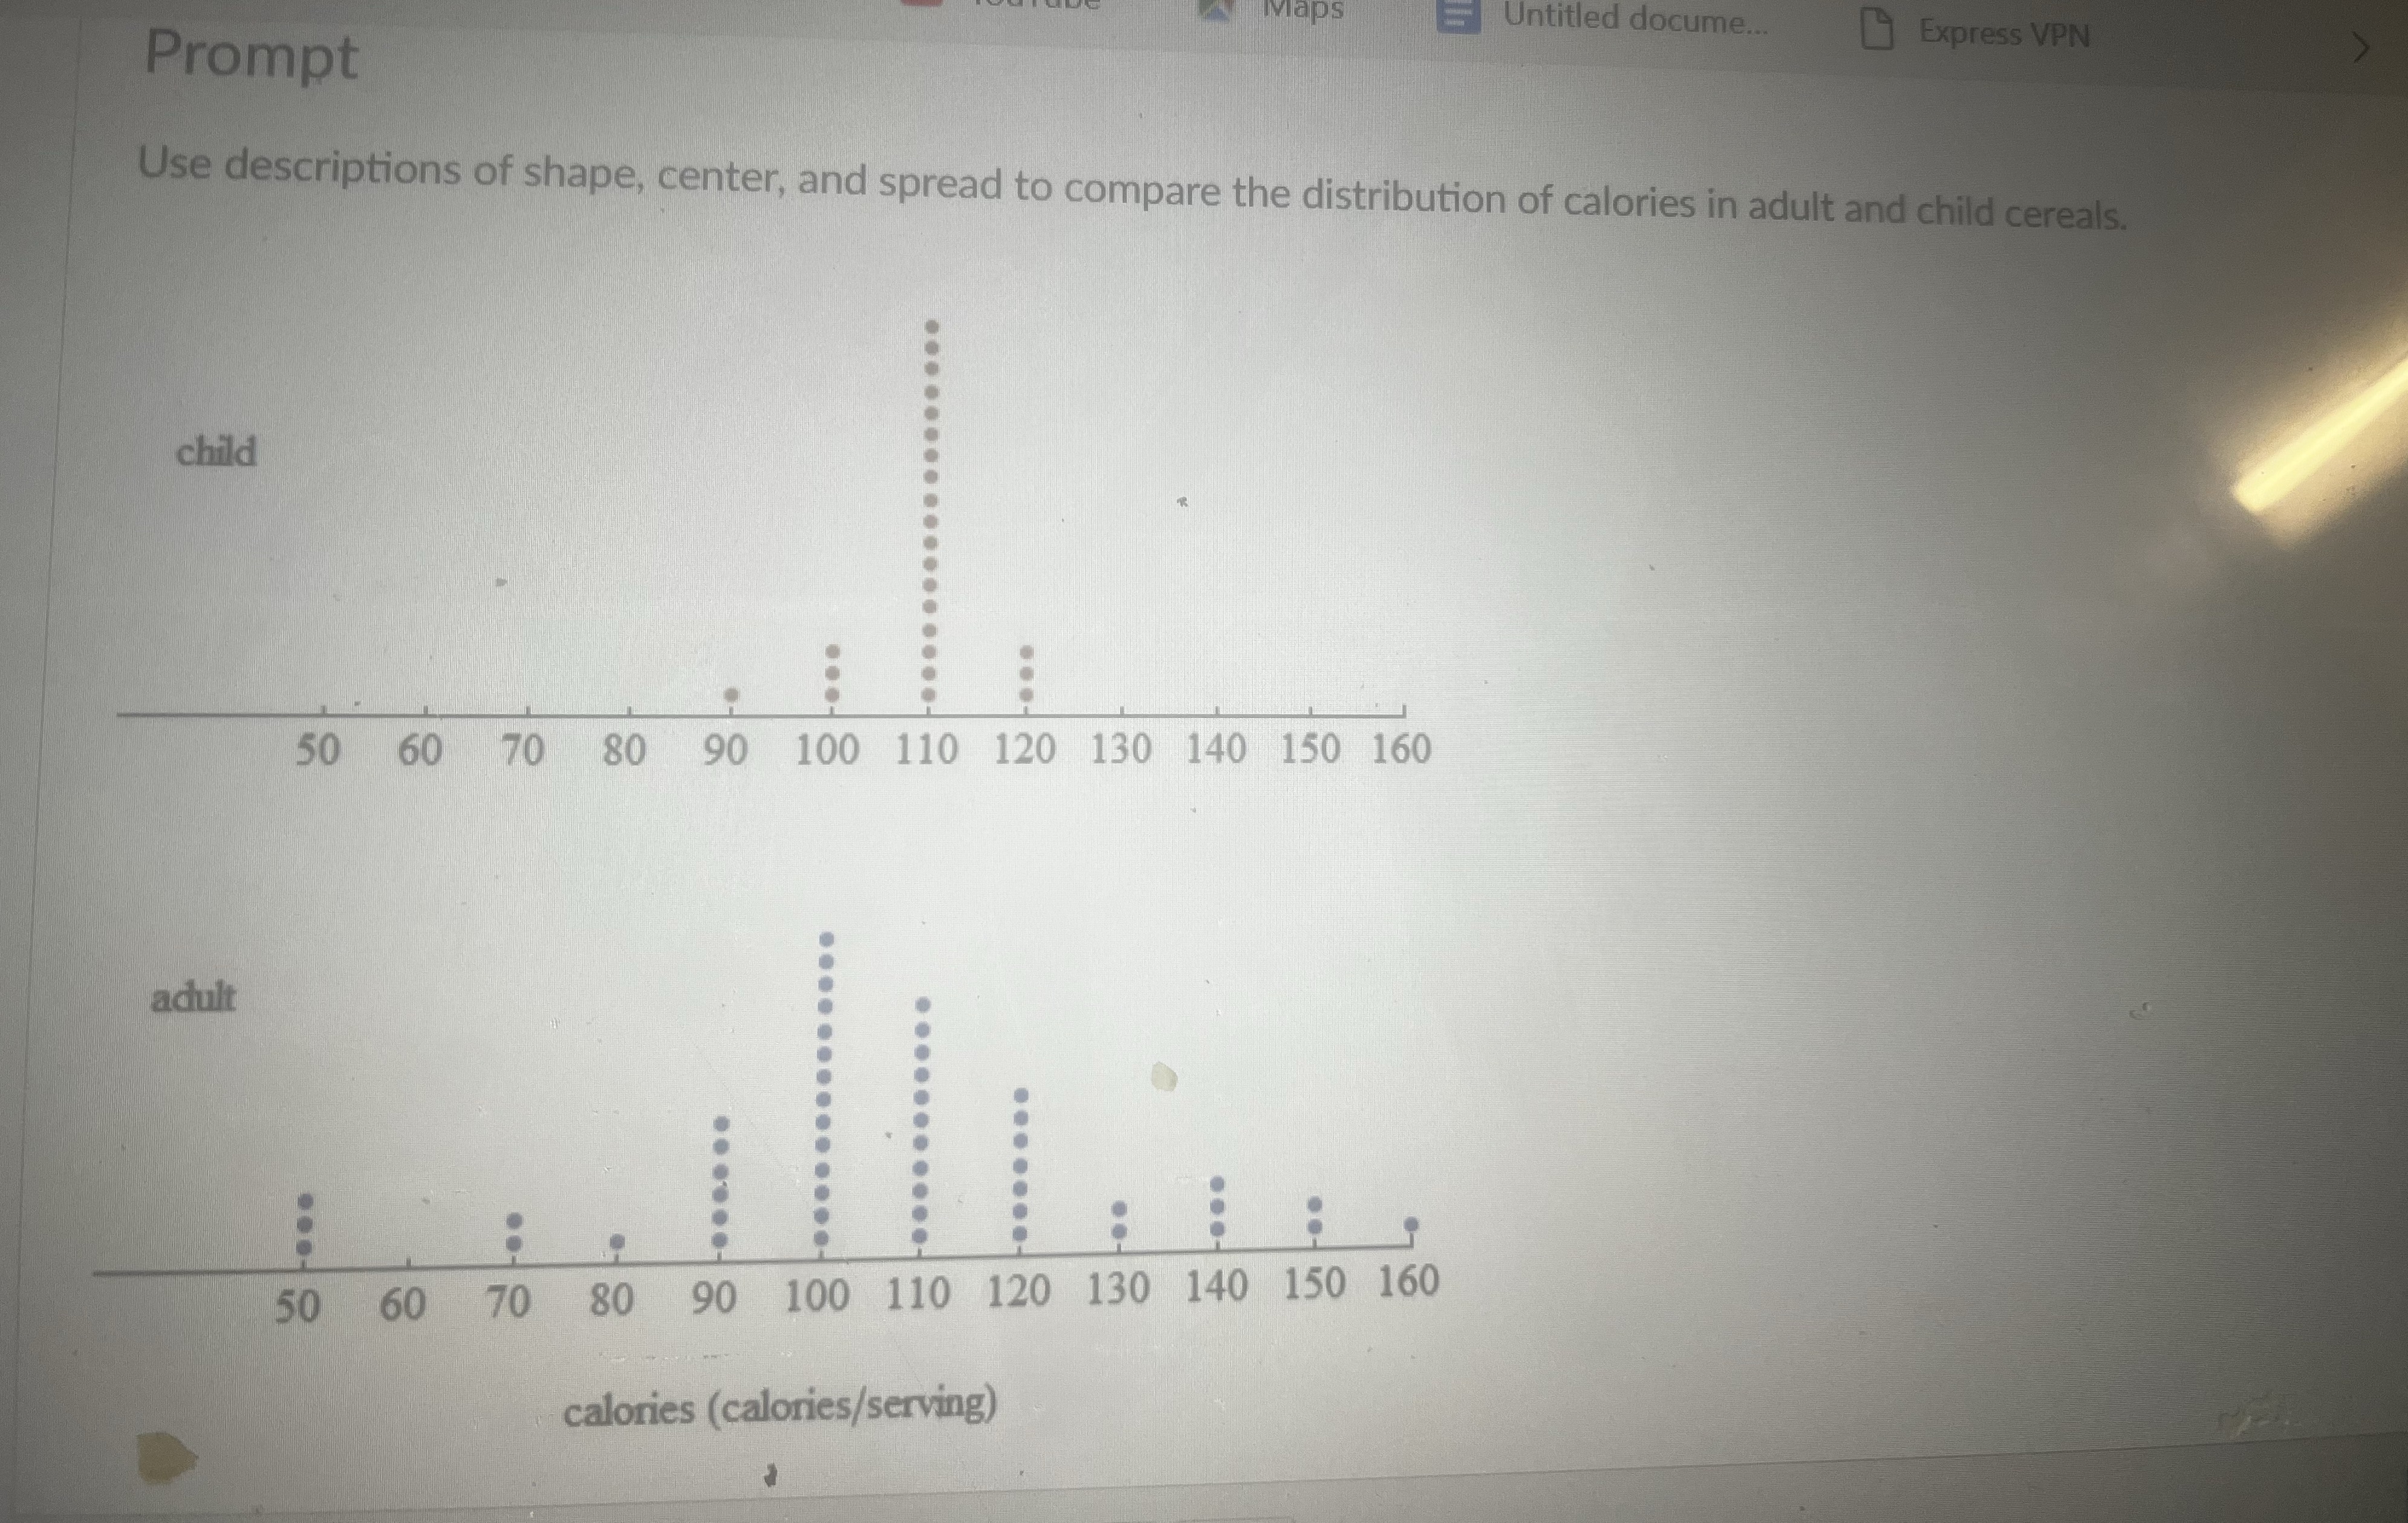
Maps Prompt Untitled docume... Express VPN Use descriptions of shape, center, and spread to compare the distribution of calories in adult and child cereals. child .................. 50 60 70 80 90 100 110 120 130 140 150 160 adult ..........oooo ........... ....... .. ... . . . .. . . -0.0 50 60 70 80 90 100 110 120 130 140 150 160 calories (calories/serving)
Step by Step Solution
There are 3 Steps involved in it
1 Expert Approved Answer
Step: 1 Unlock

Question Has Been Solved by an Expert!
Get step-by-step solutions from verified subject matter experts
Step: 2 Unlock
Step: 3 Unlock