

Question: What does this chart represent? $25.00 $20.00 $15.00 $10.00 $5.00 5 $8.00 $6.00 54.00 $2.00 $10.00 $18.00 $14.00 $16.00 $22.00 $28.00 00 OES $32.00 00
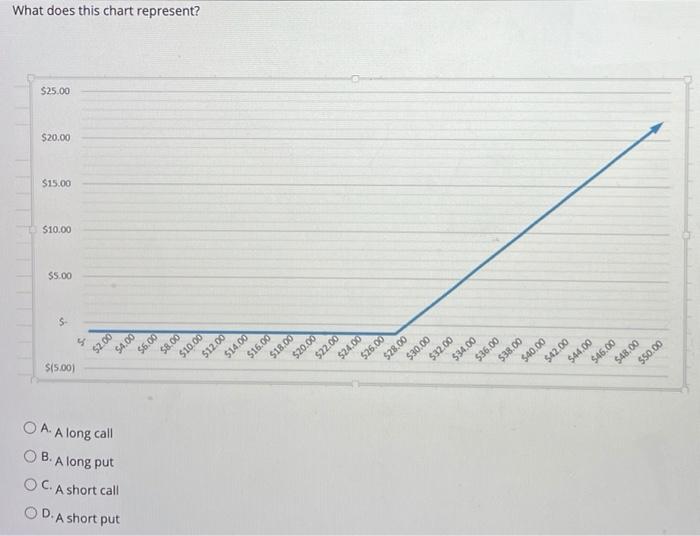
What does this chart represent? $25.00 $20.00 $15.00 $10.00 $5.00 5 $8.00 $6.00 54.00 $2.00 $10.00 $18.00 $14.00 $16.00 $22.00 $28.00 00 OES $32.00 00 955 538.00 $12.00 $20.00 $24.00 $26.00 $34.00 $15.00 $40.00 $42.00 $44.00 $46.00 $48.00 $50.00 O A. Along call B. Along put C. A short call OD. A short put
Step by Step Solution
There are 3 Steps involved in it
1 Expert Approved Answer
Step: 1 Unlock

Question Has Been Solved by an Expert!
Get step-by-step solutions from verified subject matter experts
Step: 2 Unlock
Step: 3 Unlock