

Question: What does this line represent with regard to temperature in the city? It represents the average monthly temperature. v It represents the average yearly temperature.
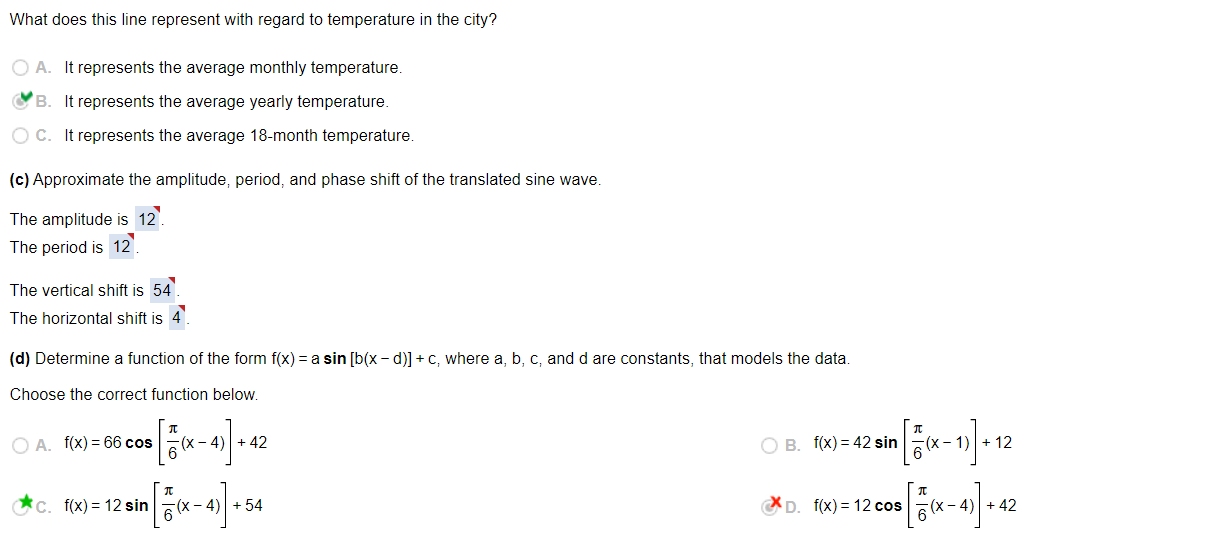
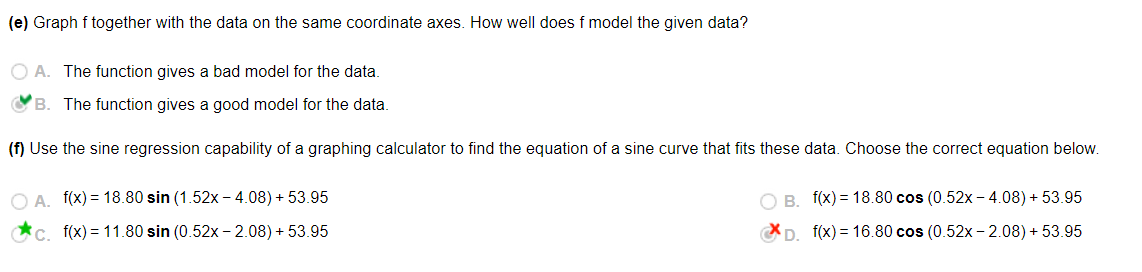
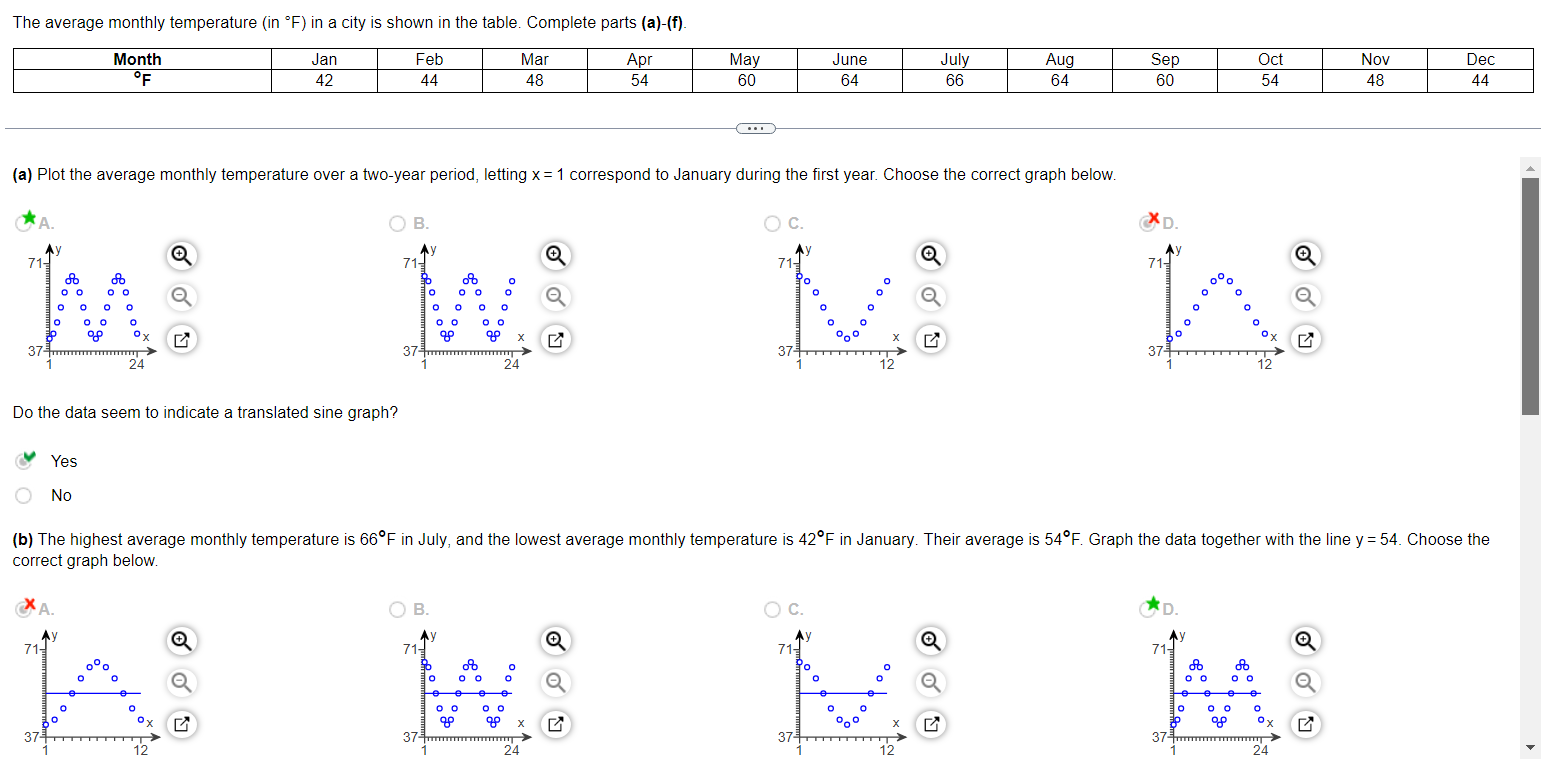
What does this line represent with regard to temperature in the city? It represents the average monthly temperature. v It represents the average yearly temperature. It represents the average 18-month temperature. (c) Approximate the amplitude, period, and phase shift of the translated sine wave. The amplitude is 12.. The period is 12 The vertical shiftis 54 . The horizontal shiftis 4 (d) Determine a function of the form f(x) = a sin[b(x d)] + c, where a, b, , and d are constants, that models the data Choose the correct function below. f(x) =66 cos {g(x - 4)} +42 T * o f(x)=12sin {g(x - 4)} +54 T f(x) =42 sin [6 (x1)}+12 X f(x)=12cos |:g{x4)} +42 (e) Graph f together with the data on the same coordinate axes. How well does f model the given data? The function gives a bad model for the data. The function gives a good model for the data. (f) Use the sine regression capability of a graphing calculator to find the equation of a sine curve that fits these data. Choose the correct equation below. f(x)=18.80 sin (1.52x - 4.08) + 53.95 f(x) = 18.80 cos (0.52x 4.08) + 53.95 * - f(x)=11.80 sin (0.52x - 2.08) + 53.95 X[ f(x)=16.80 cos (0.52x 2.08) + 53.95 The average monthly temperature (in *F) in a city is shown in the table. Complete parts (a)-(f). Month Jan Feb Mar Apr May June July Aug Sep Oct Nov Dec OF 42 44 48 54 60 64 66 64 60 54 48 44 (a) Plot the average monthly temperature over a two-year period, letting x = 1 correspond to January during the first year. Choose the correct graph below. * A. O B. O C. XD. Ay My 71- My 71- 71- 71- O O O oooo 00 0 0. 20 X 37- 37- 24 24 12 12 Do the data seem to indicate a translated sine graph? Yes O No (b) The highest average monthly temperature is 66F in July, and the lowest average monthly temperature is 42F in January. Their average is 54F. Graph the data together with the line y = 54. Choose the correct graph below. XA. O B. O C. *D. 71 71- 717 O O O 20 X X 24 12 24
Step by Step Solution
There are 3 Steps involved in it

Get step-by-step solutions from verified subject matter experts