

Question: What financial performance issues do you see at Under Armour based on the data in case Exhibits 1, 2, and 3? EXHIBIT 1 Selected
\
What financial performance issues do you see at Under Armour based on the data in case Exhibits 1, 2, and 3?
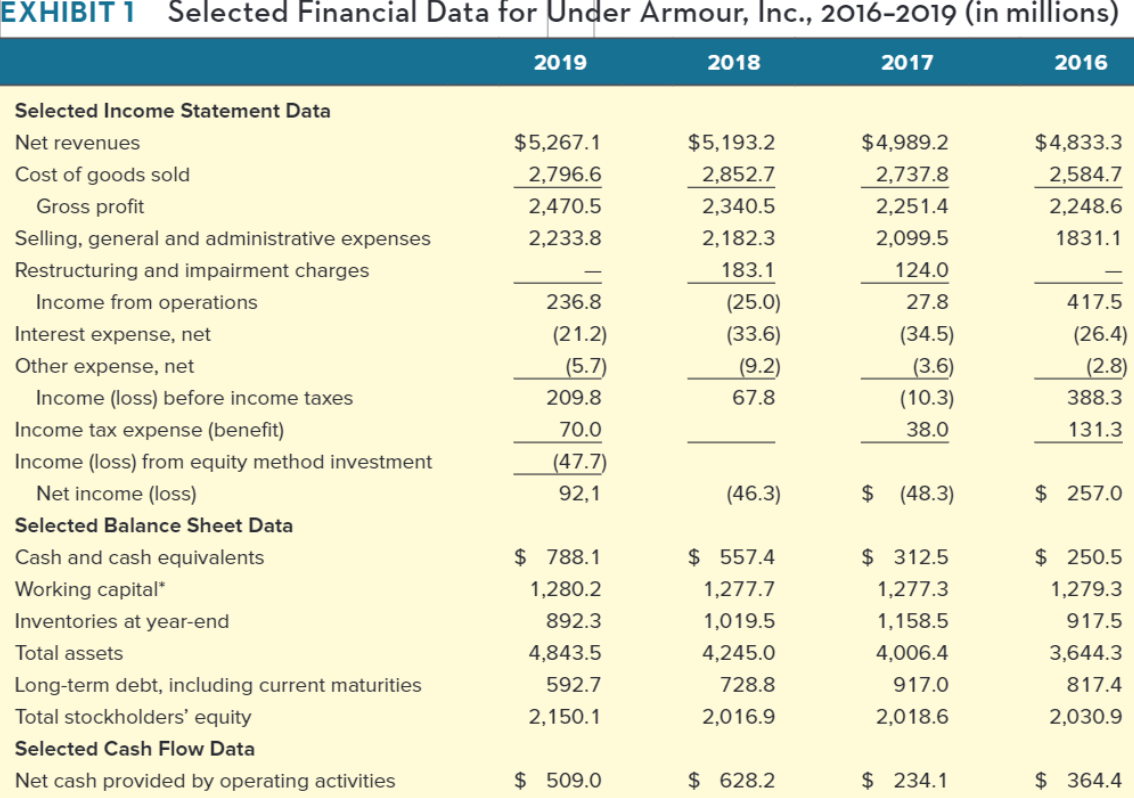
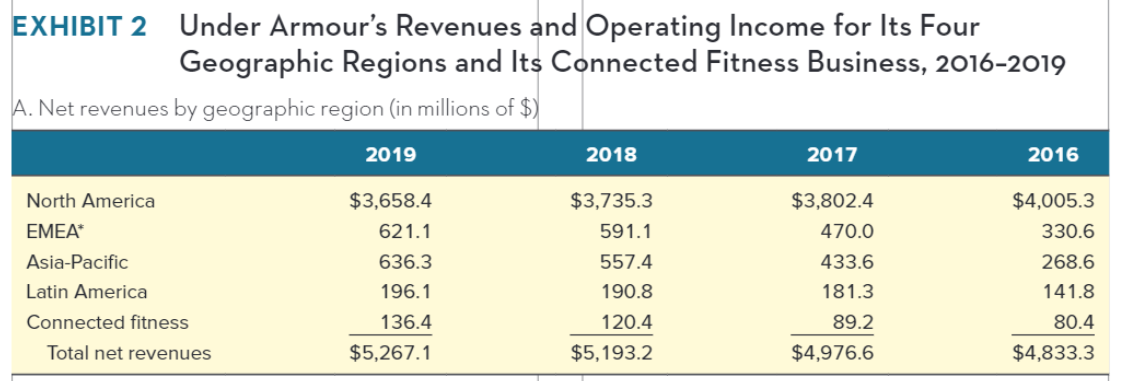
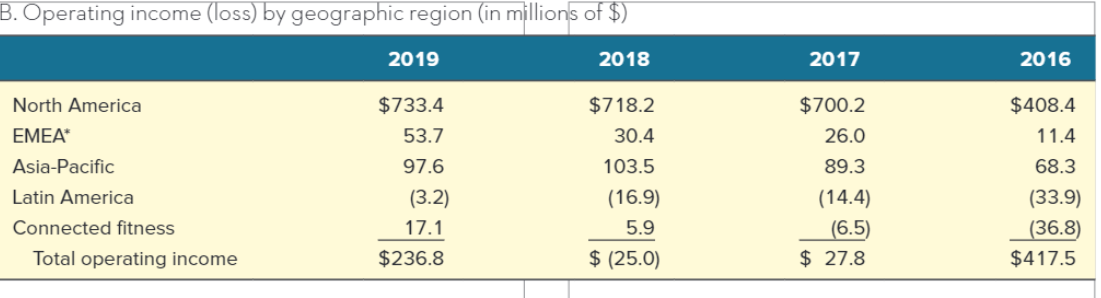
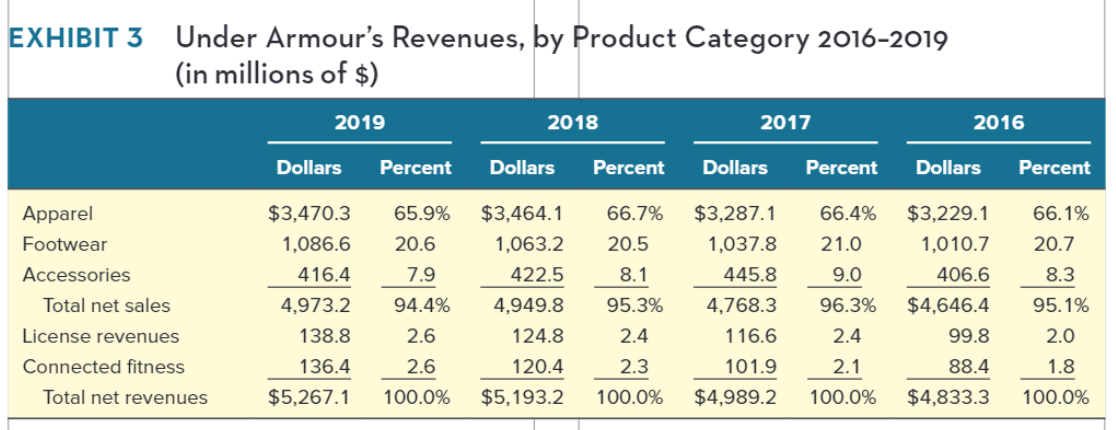
EXHIBIT 1 Selected Financial Data for Under Armour, Inc., 2016-2019 (in millions) 2019 2018 2017 2016 $5,267.1 2,796.6 2,470.5 2,233.8 $4,833.3 2,584.7 2,248.6 1831.1 $5,193.2 2,852.7 2,340.5 2,182.3 183.1 (25.0) (33.6) (9.2) 67.8 $4,989.2 2,737.8 2,251.4 2,099.5 124.0 27.8 (34.5) (3.6) (10.3) 38.0 417.5 236.8 (21.2) (5.7) 209.8 70.0 (47.7) 92,1 (26.4) (2.8) 388.3 Selected Income Statement Data Net revenues Cost of goods sold Gross profit Selling, general and administrative expenses Restructuring and impairment charges Income from operations Interest expense, net Other expense, net Income (loss) before income taxes Income tax expense (benefit) Income (loss) from equity method investment Net income (loss) Selected Balance Sheet Data Cash and cash equivalents Working capital* Inventories at year-end Total assets Long-term debt, including current maturities Total stockholders' equity Selected Cash Flow Data Net cash provided by operating activities 131.3 (46.3) $ (48.3) $ 257.0 $ 788.1 1,280.2 892.3 4,843.5 592.7 2,150.1 $ 557.4 1,277.7 1,019.5 4,245.0 728.8 2,016.9 $ 312.5 1,277.3 1,158.5 4,006.4 917.0 2,018.6 $ 250.5 1,279.3 917.5 3,644.3 817.4 2,030.9 $ 509.0 $ 628.2 $ 234.1 $ 364.4 EXHIBIT 2 Under Armour's Revenues and Operating Income for Its Four Geographic Regions and Its Connected Fitness Business, 2016-2019 A. Net revenues by geographic region (in millions of $) 2019 2018 2017 2016 North America EMEA Asia-Pacific Latin America Connected fitness Total net revenues $3,658.4 621.1 636.3 196.1 136.4 $5,267.1 $3,735.3 591.1 557.4 190.8 120.4 $5,193.2 $3,802.4 470.0 433.6 181.3 89.2 $4,976.6 $4,005.3 330.6 268.6 141.8 80.4 $4,833.3 B. Operating income (loss) by geographic region (in millions of $) 2019 2018 2017 2016 $718.2 30.4 $408.4 11.4 68.3 North America EMEA Asia-Pacific Latin America Connected fitness Total operating income $733.4 53.7 97.6 (3.2) 17.1 $236.8 103.5 (16.9) 5.9 $ (25.0) $700.2 26.0 89.3 (14.4) (6.5) $ 27.8 (33.9) (36.8) $417.5 EXHIBIT 3 Under Armour's Revenues, by Product Category 2016-2019 (in millions of $) 2019 2018 2017 2016 Dollars Percent Dollars Percent Dollars Percent Dollars Percent 66.1% 66.4% 21.0 20.7 Apparel Footwear Accessories Total net sales License revenues Connected fitness $3,470.3 1,086.6 416.4 4,973.2 138.8 136.4 $5,267.1 8.3 65.9% 20.6 7.9 94.4% 2.6 2.6 $3,464.1 1,063.2 422.5 4,949.8 124.8 120.4 $5,193.2 66.7% 20.5 8.1 95.3% 2.4 $3,287.1 1,037.8 445.8 4,768.3 1 16.6 101.9 $4,989.2 $3,229.1 1,010.7 406.6 $4,646.4 99.8 9.0 96.3% 95.1% 2.0 2.4 2.1 2.3 88.4 1.8 100.0% Total net revenues 100.0% 100.0% 100.0% $4,833.3
Step by Step Solution
There are 3 Steps involved in it

Get step-by-step solutions from verified subject matter experts