

Question: What financial performance issues do you see at Under Armour based on the data in case Exhibits 3? EXHIBIT 3 Under Armour's Revenues, by Product
What financial performance issues do you see at Under Armour based on the data in case Exhibits 3?
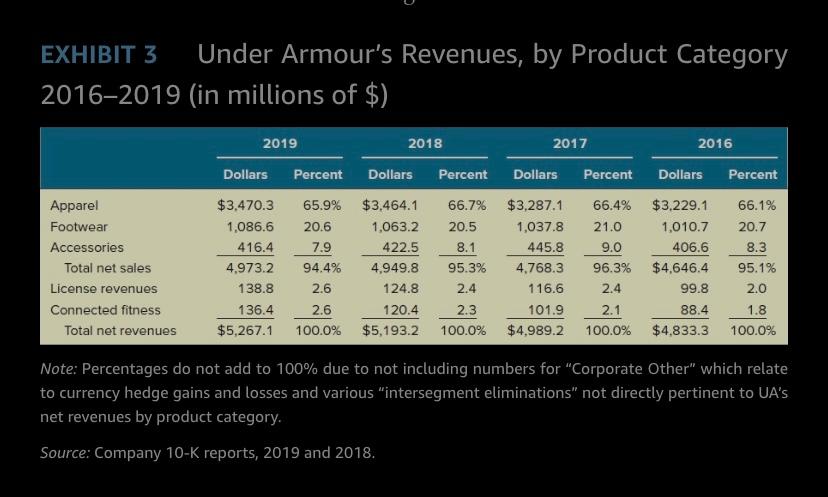
EXHIBIT 3 Under Armour's Revenues, by Product Category 20162019 (in millions of $) 2018 2017 2016 2019 Dollars Percent Dollars Percent Dollars Percent Dollars Percent 65.9% 66.4% 66.1% 21.0 Apparel Footwear Accessories Total net sales License revenues Connected fitness Total net revenues $3,470.3 1,086.6 416.4 4.973.2 138.8 136.4 $5,267.1 20.6 7.9 94.4% 2.6 2.6 100.0% $3,464.1 1,063.2 422.5 4.949.8 124.8 120.4 $5,193.2 66.7% 20.5 8.1 95.3% 2.4 2.3 100.0% $3,287.1 1,037.8 445.8 4.768.3 116.6 101.9 $4,989.2 9.0 96.3% 2.4 $3,229.1 1,010.7 406.6 $4,646.4 99.8 88.4 $4,833.3 20.7 8.3 95.1% 2.0 2.1 1.8 100.0% 100.0% Note: Percentages do not add to 100% due to not including numbers for "Corporate Other" which relate to currency hedge gains and losses and various "intersegment eliminations" not directly pertinent to UA's net revenues by product category. Source: Company 10-K reports, 2019 and 2018
Step by Step Solution
There are 3 Steps involved in it
1 Expert Approved Answer
Step: 1 Unlock

Question Has Been Solved by an Expert!
Get step-by-step solutions from verified subject matter experts
Step: 2 Unlock
Step: 3 Unlock