

Question: What is impressive about Under Armours financial performance during the 2011-2015 period (as shown in case Exhibit 1)? Provide a thorough analysis with as much
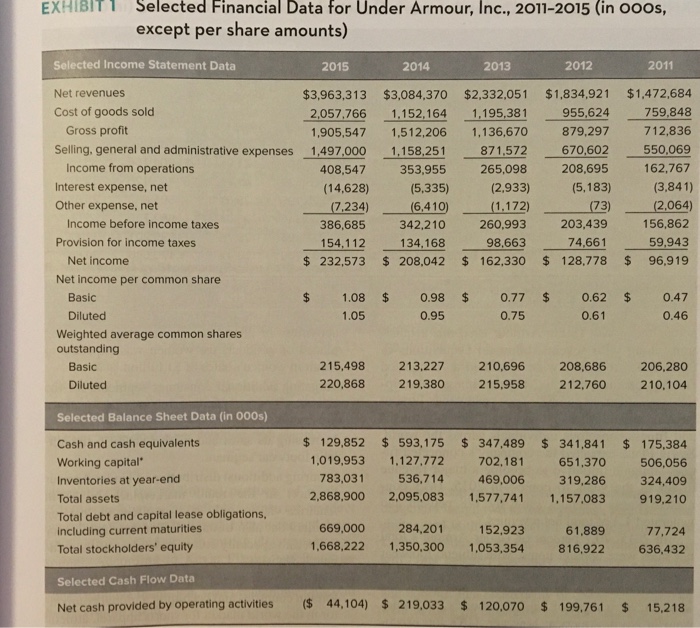
EXHIBIT T Selected Financial Data for Under Armour, Inc., 2011-2015 (in ooos except per share amounts) 2011 Selected Income Statement Data Net revenues Cost of goods sold 2015 2014 2013 2012 $3,963,313 $3,084,370 $2,332,051 $1,834,921 $1,472,684 759.848 1,905,547 1,512,206 1,136,670 879,297 712,836 550,069 353,955 265,098 208,695 162,767 (3,841) 2,057,766 1.152,164 1,195,381 955,624 Gross profit Selling, general and administrative expenses 1.497.000 1.158,251 871.572 670,602 Income from operations Interest expense, net Other expense, net 408,547 (14,628) (5,183) Income before income taxes Provision for income taxes 386,685 154,112 $232,573 203,439 156,862 59,943 208,042 $ 162,330 128,778 $ 96,919 6.410) (1.172)(73) (2064) 342,210 134,168 260,993 98663 74,661 Net income Net income per common share $1.08$ 0.98 $ 0.77$ 0.62 0.47 0.46 Basic Diluted 0.95 0.75 0.61 Weighted average common shares outstanding 215,498 220,868 213,227 210,696 208,686 206,280 219,380 Basic Diluted 215,958 212,760 210,104 Selected Balance Sheet Data (in 000s) Cash and cash equivalents Working capital' Inventories at year-end Total assets Total debt and capital lease obligations, including current maturities Total stockholders' equity $129,852 593,175 $347,489$ 341,841 175,384 651,370 506,056 319,286 324,409 919,210 1,019,953 1,127,772 536,714 702,181 469,006 783,031 2,868,900 2,095,083 1,5 77,741 1,157,083 284,201 1.668,222 1,350,300 1,053,354 669,000 61,889 6,922 152.923 77,724 636,432 Selected Cash Flow Data Net cash provided by operating activities ( 44,104) 219,033 $ 120,070 199.761 s 15.218
Step by Step Solution
There are 3 Steps involved in it

Get step-by-step solutions from verified subject matter experts