

Question: Under Armours Strategy in 2016How Big a Factor Can the Company Become in the $250 Billion Global Market for Sports Apparel and Footwear? What is
Under Armours Strategy in 2016How Big a Factor Can the Company Become in the $250 Billion Global Market for Sports Apparel and Footwear?
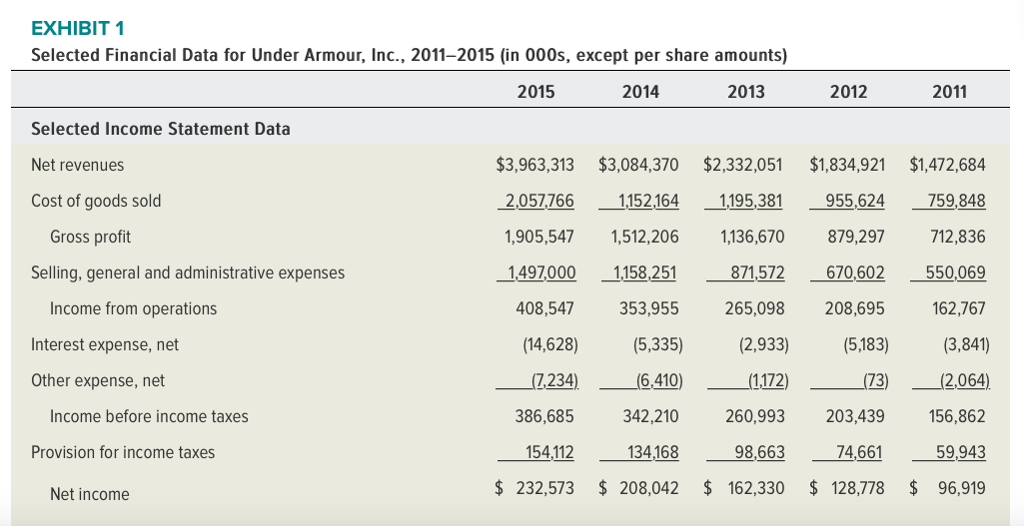
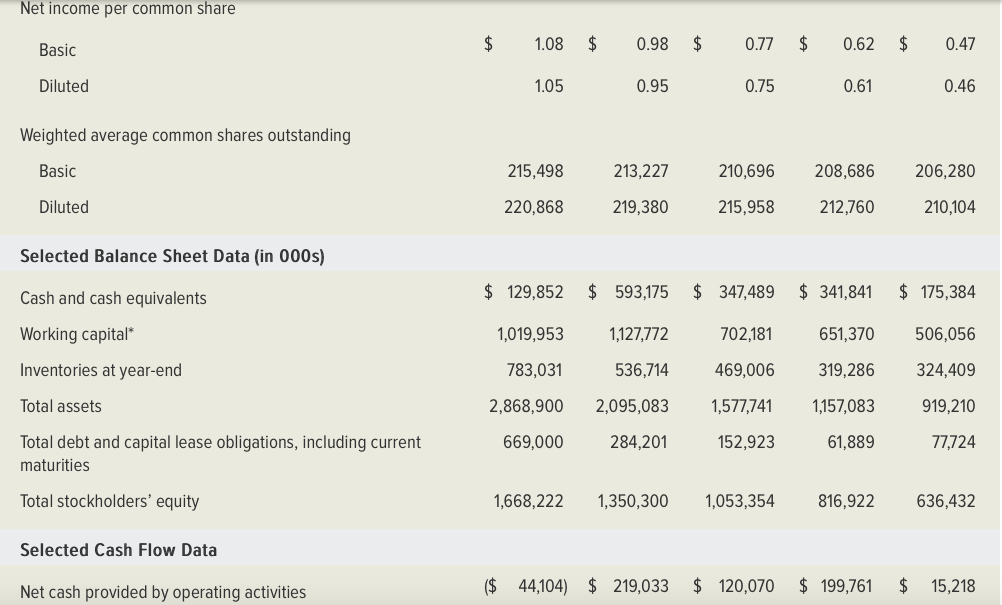
What is impressive about Under Armours financial performance during the 2011-2015 period (as shown in case Exhibit 1)?
Select true or false for each of the following statements concerning the data in case Exhibit 1. Use the key financial ratios in Chapter 4 to assist you in performing calculations to determine whether the statements are true or false. In addition to the financial ratios, you will also need to calculate compound average growth rates (CAGR) for certain financial measures. The formula for calculating CAGR (in percentage terms) is as follows:
CAGR % = [ending value beginning value] 1 1 100 (where n = the number of year-to-year or period-to-period changes)
1. From 2011 through 2015, Under Armours compound average growth rate in net revenues was a strong 28.1%. True/ False
2. UAs income from operations rose from $162.8 million in fiscal 2011 to $408.5 million in fiscal 2015, an increase of 250.9% and a very healthy compound average growth rate of 25.9%. True/ False
3. UAs net income fell from $232.3 million in fiscal 2011 to $150.9 million in fiscal 2015. True/ False
4. UAs diluted net income per share rose from $0.46 in 2011 to $1.05 in 2015, an increase of 228.3% and a strong compound average growth rate of 22.9%. True/ False
5. UA incurred considerable debt in order to finance its rapid growth. True/ False
6. UAs working capital has doubled since 2011.True/ False
7. UA debt is $669 million versus $1.67 billion in stockholders equity at the end of fiscal 2015. True/ False
EXHIBIT 1 Selected Financial Data for Under Armour, Inc., 2011-2015 (in 000s, except per share amounts) 2015 2014 2013 2012 2011 Selected Income Statement Data Net revenues Cost of goods sold $3,963,313 $3,084,370 $2,332,051 $1,834,921 $1,472,684 955,624 759,848 712,836 871,572 670,602 550,069 162,767 (3,841) 1112) (73) L2064) 2,057,766 1 1152164 1,195,381 1,905,547 1512,206 1,136,670 1158.251871572 Gross profit 879,297 Selling, general and administrative expenses 1497000 1158,251 353,955 (5,335) (7.234) (6,410) 408,547 265,098 208,695 Income from operations Interest expense, net Other expense, net (14,628) (2,933) (5,183) Income before income taxes 342,210 260,993 203,439 156,862 59,943 $ 232,573 $ 208,042 $ 162,330 $ 128,778 $ 96,919 386,685 Provision for income taxes 154.112 134,168 98,663 74 74,661 Net income EXHIBIT 1 Selected Financial Data for Under Armour, Inc., 2011-2015 (in 000s, except per share amounts) 2015 2014 2013 2012 2011 Selected Income Statement Data Net revenues Cost of goods sold $3,963,313 $3,084,370 $2,332,051 $1,834,921 $1,472,684 955,624 759,848 712,836 871,572 670,602 550,069 162,767 (3,841) 1112) (73) L2064) 2,057,766 1 1152164 1,195,381 1,905,547 1512,206 1,136,670 1158.251871572 Gross profit 879,297 Selling, general and administrative expenses 1497000 1158,251 353,955 (5,335) (7.234) (6,410) 408,547 265,098 208,695 Income from operations Interest expense, net Other expense, net (14,628) (2,933) (5,183) Income before income taxes 342,210 260,993 203,439 156,862 59,943 $ 232,573 $ 208,042 $ 162,330 $ 128,778 $ 96,919 386,685 Provision for income taxes 154.112 134,168 98,663 74 74,661 Net income
Step by Step Solution
There are 3 Steps involved in it

Get step-by-step solutions from verified subject matter experts