

Question: What is incorrect with this? Its just calculating the numbers per the chart based on the year and label. Pepsico Inc. For Years ended December
What is incorrect with this? Its just calculating the numbers per the chart based on the year and label.
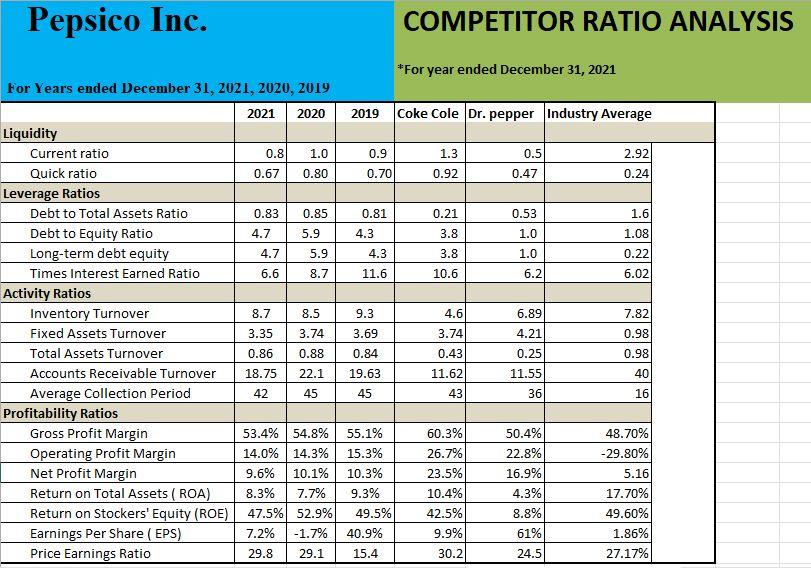
Pepsico Inc. For Years ended December 31, 2021, 2020, 2019 2020 Liquidity Current ratio Quick ratio Leverage Ratios Debt to Total Assets Ratio Debt to Equity Ratio Long-term debt equity Times Interest Earned Ratio Activity Ratios Inventory Turnover Fixed Assets Turnover Total Assets Turnover Accounts Receivable Turnover Average Collection Period Profitability Ratios Gross Profit Margin Operating Profit Margin Net Profit Margin Return on Total Assets (ROA) Return on Stockers' Equity (ROE) Earnings Per Share (EPS) Price Earnings Ratio 2021 0.8 0.67 0.83 0.85 4.7 5.9 4.7 6.6 1.0 0.80 8.7 3.35 0.86 18.75 42 5.9 8.7 8.5 3.74 0.88 22.1 45 2019 Coke Cole Dr. pepper Industry Average 0.9 0.70 0.81 4.3 4.3 11.6 9.3 3.69 0.84 19.63 45 COMPETITOR RATIO ANALYSIS *For year ended December 31, 2021 53.4% 54.8% 55.1% 14.0% 14.3% 15.3% 9.6% 10.1% 10.3% 8.3% 7.7% 9.3% 47.5% 52.9% 49.5% 7.2% -1.7% 40.9% 29.8 29.1 15.4 1.3 0.92 0.21 3.8 3.8 10.6 4.6 3.74 0.43 11.62 43 60.3% 26.7% 23.5% 10.4% 42.5% 9.9% 30.2 0.5 0.47 0.53 1.0 1.0 6.2 6.89 4.21 0.25 11.55 36 50.4% 22.8% 16.9% 4.3% 8.8% 61% 24.5 2.92 0.24 1.6 1.08 0.22 6.02 7.82 0.98 0.98 40 16 48.70% -29.80% 5.16 17.70% 49.60% 1.86% 27.17%
Step by Step Solution
3.43 Rating (162 Votes )
There are 3 Steps involved in it
Answer A First come first served A B C D Sequnce for shortest processing time D C B A Sequnce f... View full answer

Get step-by-step solutions from verified subject matter experts