

Question: What is not a correct interpretation of this regression plot of Google ad investments (X) and profits (Y) ? Google ad investments have a linear
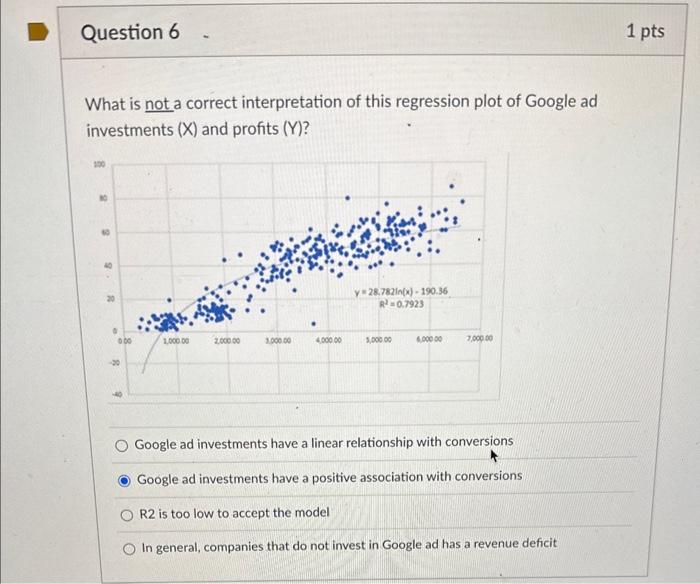
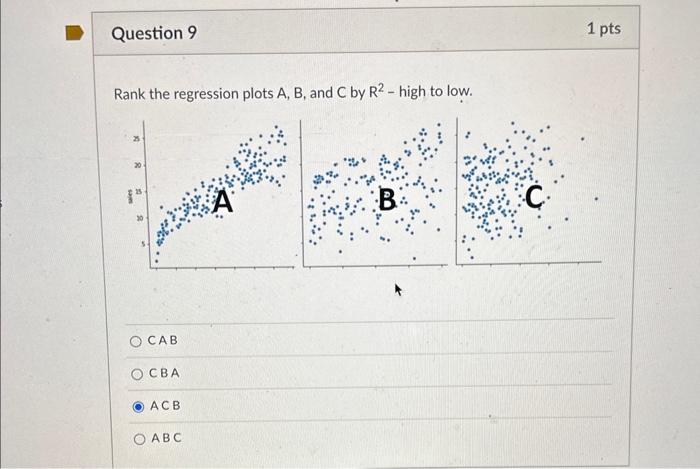
What is not a correct interpretation of this regression plot of Google ad investments (X) and profits (Y) ? Google ad investments have a linear relationship with conversions Google ad investments have a positive association with conversions R2 is too low to accept the model In general, companies that do not invest in Google ad has a revenue deficit Rank the regression plots A,B, and C by R2 - high to low. CAB C B A ACB ABC
Step by Step Solution
There are 3 Steps involved in it
1 Expert Approved Answer
Step: 1 Unlock

Question Has Been Solved by an Expert!
Get step-by-step solutions from verified subject matter experts
Step: 2 Unlock
Step: 3 Unlock