

Question: What is SST? A: Total squares error from the regression line B: Total squares error from the mean aka original error amount C: Total amount
What is SST?
A: Total squares error from the regression line
B: Total squares error from the mean aka original error amount
C: Total amount error was reduced from the original
D: Regression line format
E: the percentage the error was reduced compared to the original shown as two decimal number
What is SSE?
A: Total squares error from the regression line
B: Total squares error from the mean aka original error amount
C: Total amount error was reduced from the original
D: Regression line format
E: the percentage the error was reduced compared to the original shown as two decimal number
What is SSR?
A: Total squares error from the regression line
B: Total squares error from the mean aka original error amount
C: Total amount error was reduced from the original
D: Regression line format
E: the percentage the error was reduced compared to the original shown as two decimal number
Yhat= coefficient(x) + intercept
A: Total squares error from the regression line
B: Total squares error from the mean aka original error amount
C: Total amount error was reduced from the original
D: Regression line format
E: the percentage the error was reduced compared to the original shown as two decimal number
R squared?
A: Total squares error from the regression line
B: Total squares error from the mean aka original error amount
C: Total amount error was reduced from the original
D: Regression line format
E: the percentage the error was reduced compared to the original shown as two decimal number
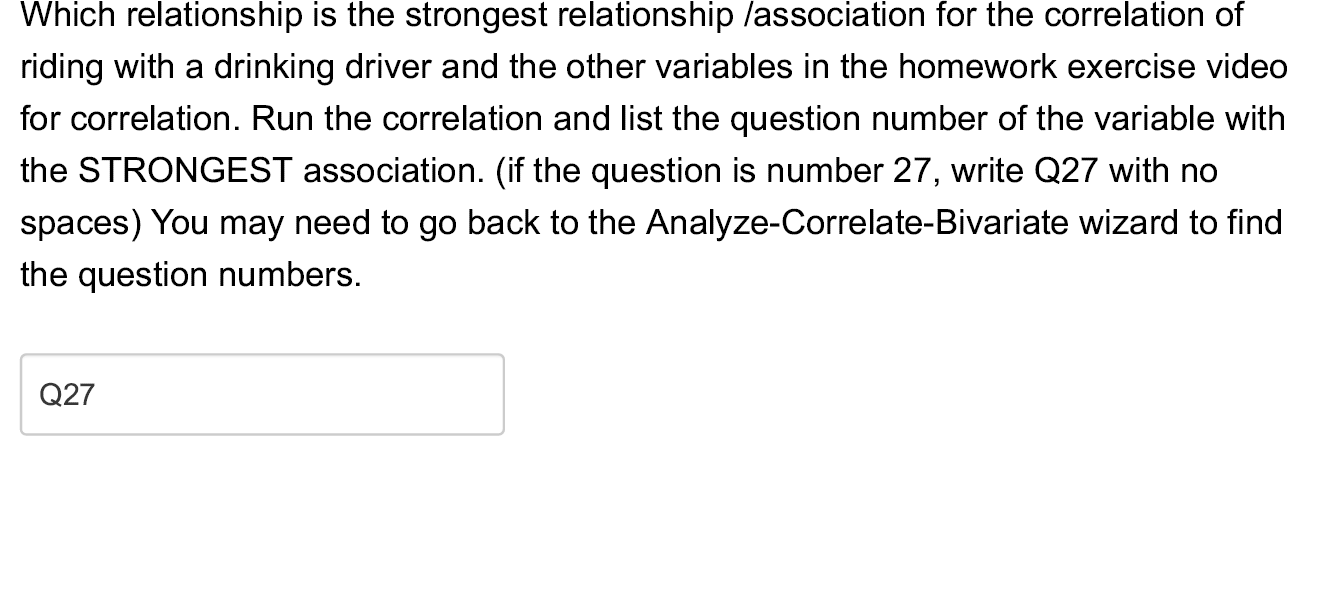


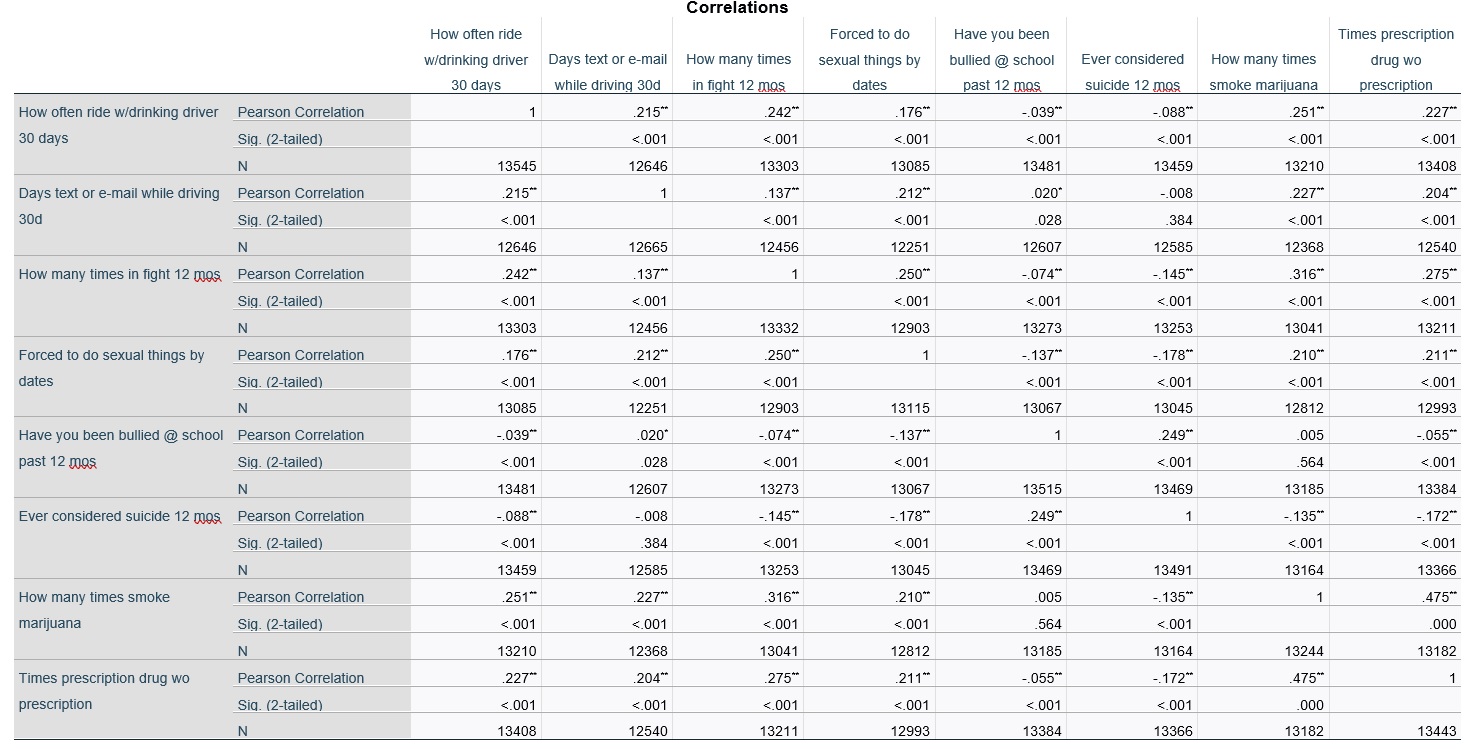
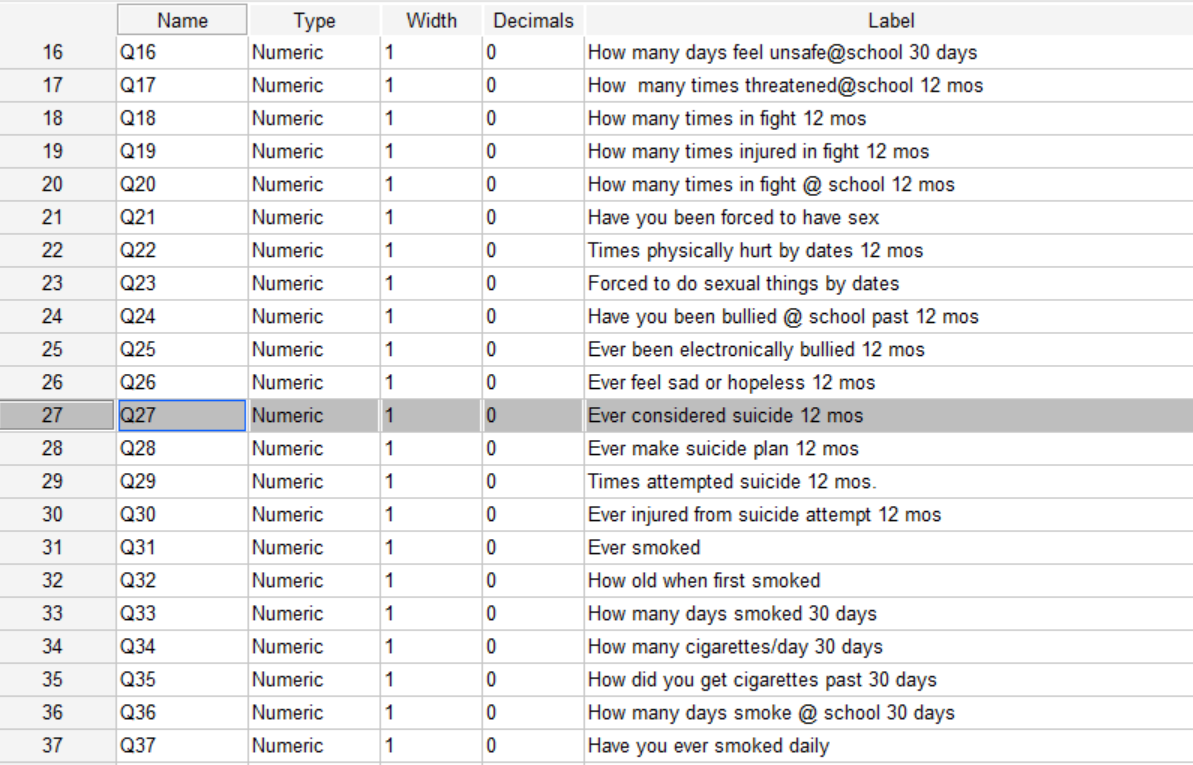
Which relationship is the strongest relationship /association for the correlation of riding with a drinking driver and the other variables in the homework exercise video for correlation. Run the correlation and list the question number of the variable with the STRONGEST association. (if the question is number 27, write 027 with no spaces) You may need to go back to the Analyze-Correlate-Bivariate wizard to find the question numbers. 027 Correlations How often ride Forced to do Have you been w/drinking driver Times prescription Days text or e-mail How many times sexual things by bullied @ school Ever considered How many times 30 days drug wo while driving 30d in fight 12 mos dates past 12 mos How often ride w/drinking driver Pearson Correlation suicide 12 mos smoke marijuana prescription 215* 242* 176* 30 days -.039* .088* Sig. (2-tailed) 251" 227" <.001 n days text or e-mail while driving pearson correlation .008 sig. .204 .028 how many times in fight mos. .242 .074 forced to do sexual things by dates sia. have you been bullied school past .249 ever considered suicide mos smoke .251 .316 marijuana .564 prescription drug wo type width decimals label q16 numeric feel unsafe q17 o threatened q18 q19 injured q20 q21 sex q22 physically hurt q23 q24 q25 electronically q26 sad hopeless q27 q28 make plan q29 attempted q30 from attempt q31 smoked q32 old when first q33 q34 cigarettes q35 did get q36 q37 daily>
Step by Step Solution
There are 3 Steps involved in it

Get step-by-step solutions from verified subject matter experts