

Question: what is the answer for this one thanks Question 1 1 pts To explore the behavior of confidence intervals we need to simulate many samples
what is the answer for this one thanks
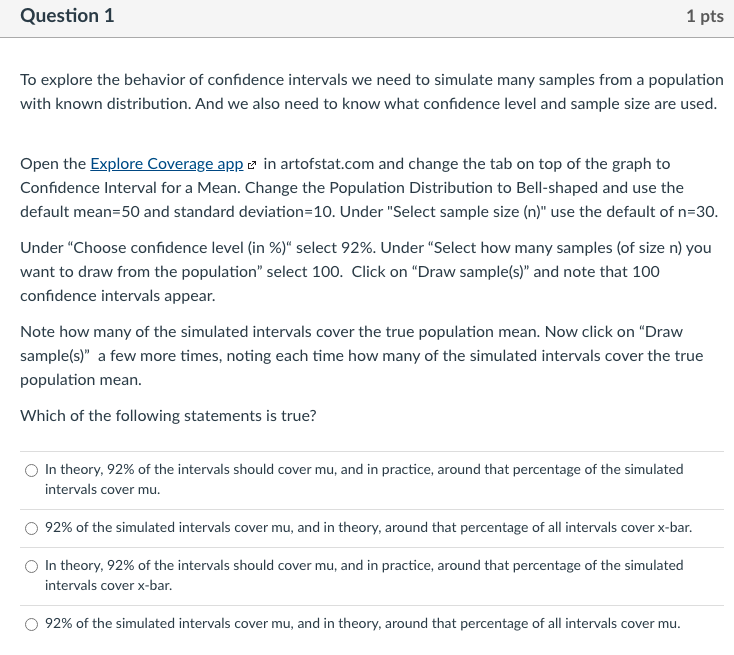
Question 1 1 pts To explore the behavior of confidence intervals we need to simulate many samples from a population with known distribution. And we also need to know what confidence level and sample size are used. Open the Explore Coverage appa in artofstat.com and change the tab on top of the graph to Confidence Interval for a Mean. Change the Population Distribution to Bell-shaped and use the default mean=50 and standard deviation=10. Under "Select sample size (n)" use the default of n=30. Under "Choose confidence level (in %)" select 92%. Under "Select how many samples (of size n) you want to draw from the population" select 100. Click on "Draw sample(s)" and note that 100 confidence intervals appear. Note how many of the simulated intervals cover the true population mean. Now click on "Draw sample(s)" a few more times, noting each time how many of the simulated intervals cover the true population mean. Which of the following statements is true? O In theory, 92% of the intervals should cover mu, and in practice, around that percentage of the simulated intervals cover mu. 92% of the simulated intervals cover mu, and in theory, around that percentage of all intervals cover x-bar. O In theory, 92% of the intervals should cover mu, and in practice, around that percentage of the simulated intervals cover x-bar. 92% of the simulated intervals cover mu, and in theory, around that percentage of all intervals cover mu
Step by Step Solution
There are 3 Steps involved in it

Get step-by-step solutions from verified subject matter experts