

Question: What is the answer to this? (with explanation) A recent survey by YouGov.com asked participants how long they thought they would survive compared to most
What is the answer to this? (with explanation)
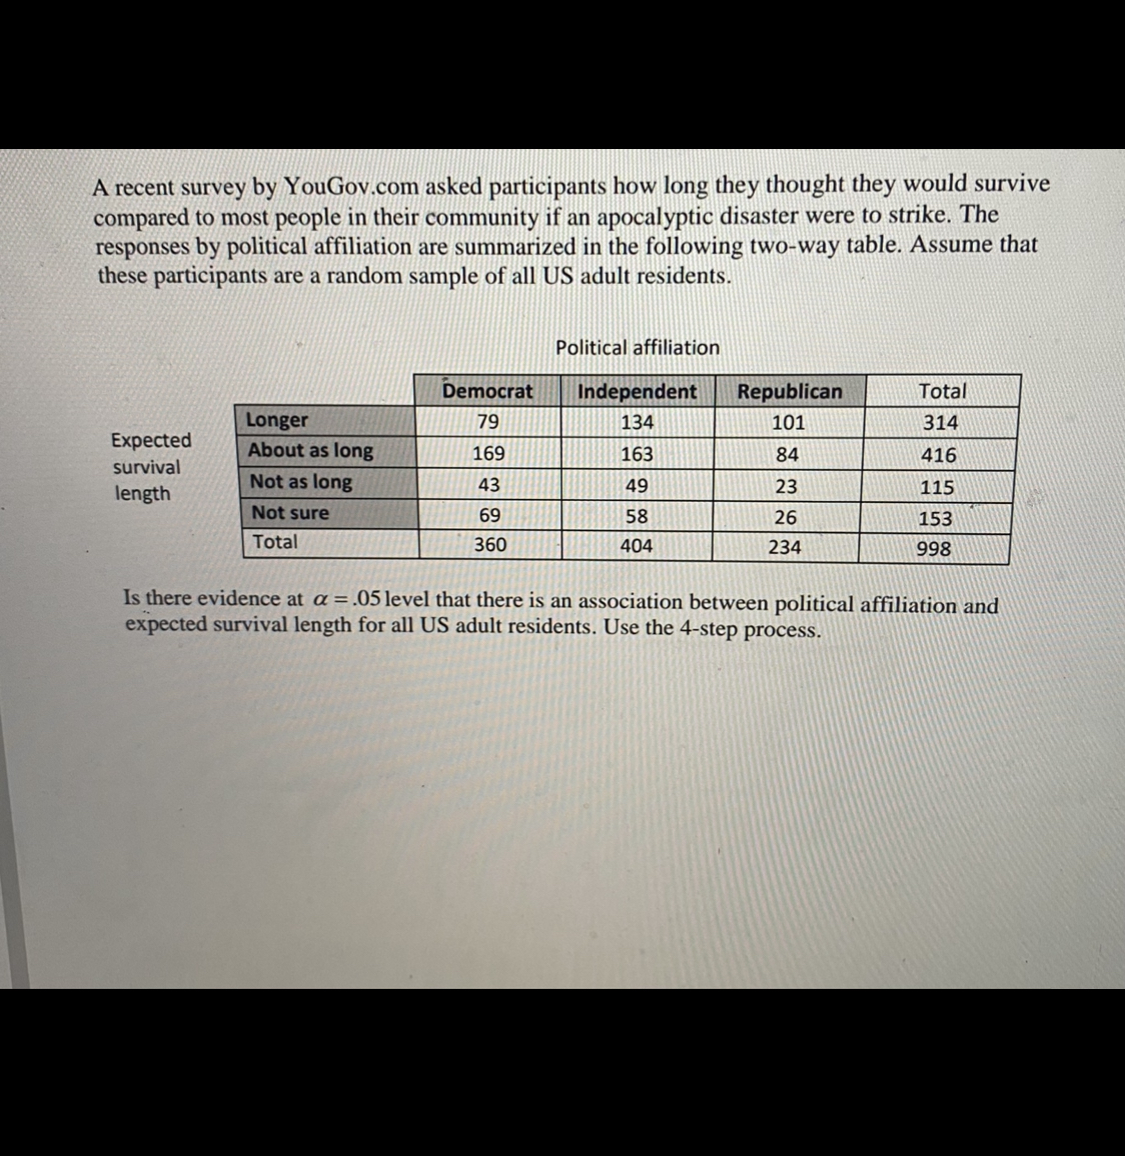
A recent survey by YouGov.com asked participants how long they thought they would survive compared to most people in their community if an apocalyptic disaster were to strike. The responses by political affiliation are summarized in the following two-way table. Assume that these participants are a random sample of all US adult residents. Political affiliation Democrat Independent Republican Total Longer 79 134 101 314 Expected About as long 169 163 84 416 survival length Not as long 43 49 23 115 Not sure 69 58 26 153 Total 360 404 234 998 Is there evidence at a = .05 level that there is an association between political affiliation and expected survival length for all US adult residents. Use the 4-step process
Step by Step Solution
There are 3 Steps involved in it

Get step-by-step solutions from verified subject matter experts