

Question: what is the connection between the Data analysis (Cross-Tabulation) below and the marketing context? what is their relationship? V4CyclingActivity * V1Gender Crosstab Count V1 Gender


what is the connection between the Data analysis (Cross-Tabulation) below and the marketing context? what is their relationship?
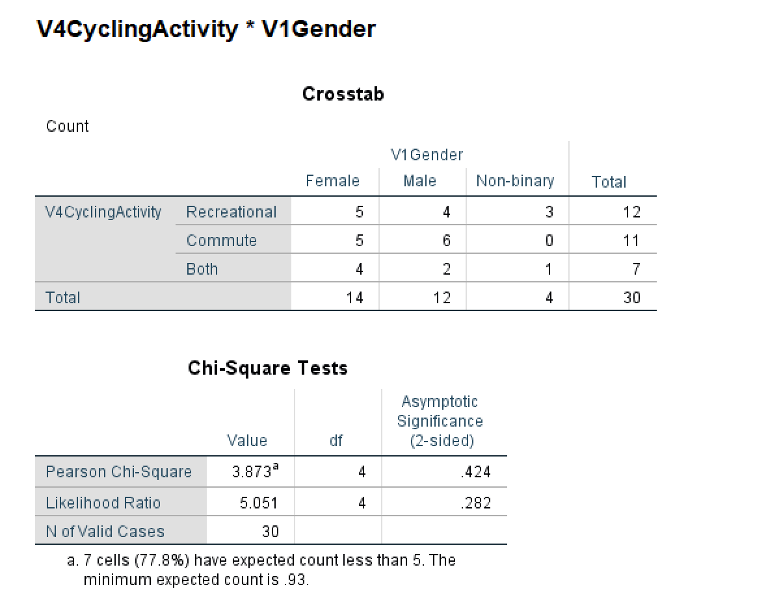
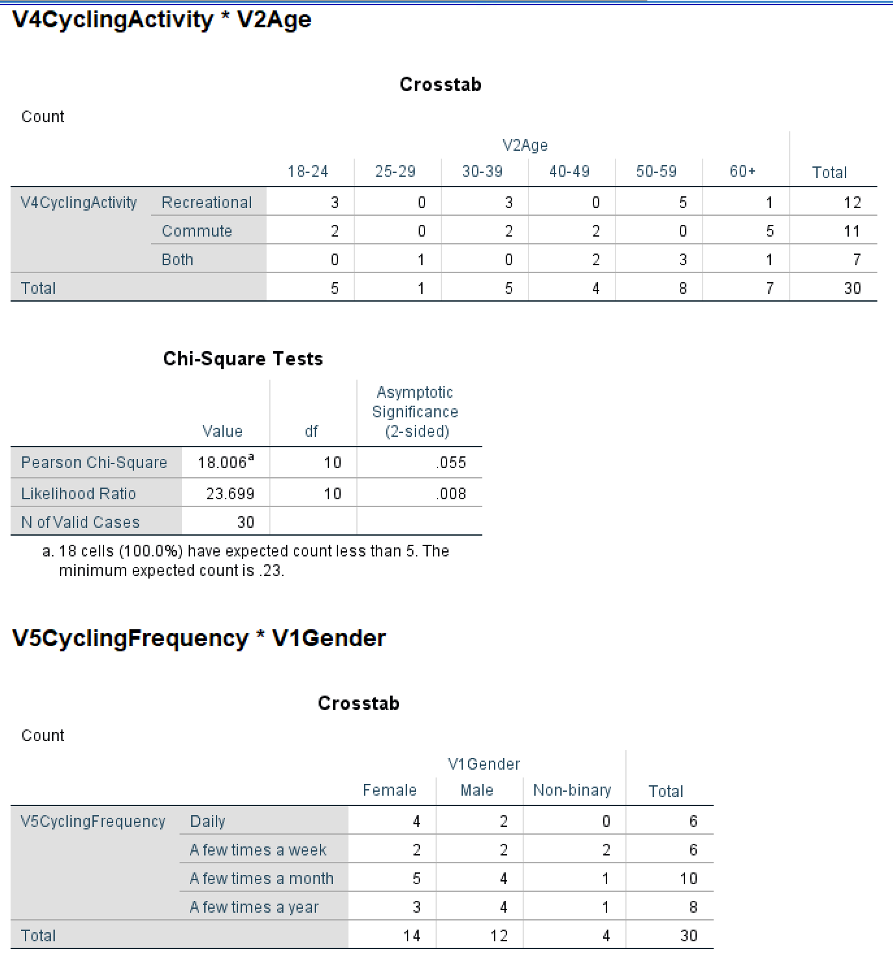
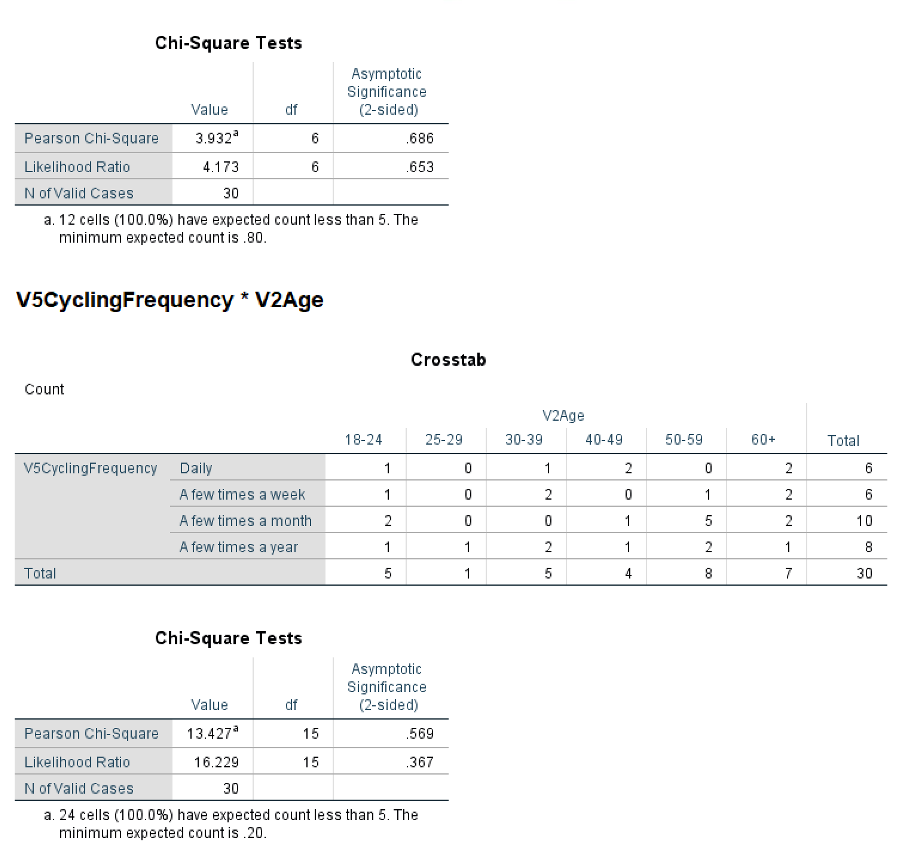
V4CyclingActivity * V1Gender Crosstab Count V1 Gender Female Male Non-binary Total V4CyclingActivity Recreational 5 4 3 12 Commute 5 6 11 Both 4 2 7 Total 14 12 4 30 Chi-Square Tests Asymptotic Significance Value df (2-sided) Pearson Chi-Square 3.873 4 424 Likelihood Ratio 5.051 4 282 N of Valid Cases 30 a. 7 cells (77.8%) have expected count less than 5. The minimum expected count is .93.V4CyclingActivity * V2Age Crosstab Count V2Age 18-24 25-29 30-39 40-49 50-59 60+ Total V4CyclingActivity Recreational 3 0 3 0 5 1 12 Commute 2 0 N 0 5 11 Both 0 0 2 3 1 7 Total 6 4 8 7 30 Chi-Square Tests Asymptotic Significance Value df (2-sided) Pearson Chi-Square 18.006 10 055 Likelihood Ratio 23.699 10 008 N of Valid Cases 30 a. 18 cells (100.0%) have expected count less than 5. The minimum expected count is .23. V5CyclingFrequency * V1Gender Crosstab Count V1 Gender Female Male Non-binary Total V5CyclingFrequency Daily 4 2 6 A few times a week 6 A few times a month 5 10 A few times a year 3 8 Total 14 12 4 30Chi-Square Tests Asymptotic Significance Value df (2-sided) Pearson Chi-Square 3.932 6 686 Likelihood Ratio 4.173 6 653 N of Valid Cases 30 a. 12 cells (100.0%) have expected count less than 5. The minimum expected count is .80. V5CyclingFrequency * V2Age Crosstab Count V2Age 18-24 25-29 30-39 40-49 50-59 60+ Total V5CyclingFrequency Daily 1 0 2 6 A few times a week 0 2 6 ON A few times a month 2 5 N 10 A few times a year 1 2 2 8 Total 5 5 8 7 30 Chi-Square Tests Asymptotic Significance Value df (2-sided) Pearson Chi-Square 13.427 15 569 Likelihood Ratio 16.229 15 367 N of Valid Cases 30 a. 24 cells (100.0%) have expected count less than 5. The minimum expected count is .20
Step by Step Solution
There are 3 Steps involved in it

Get step-by-step solutions from verified subject matter experts