

Question: What is the interquartile range of the sample data represented in the following stem and leaf diagram? Stem (tens) Leaf (ones) 0 3,3,9 1
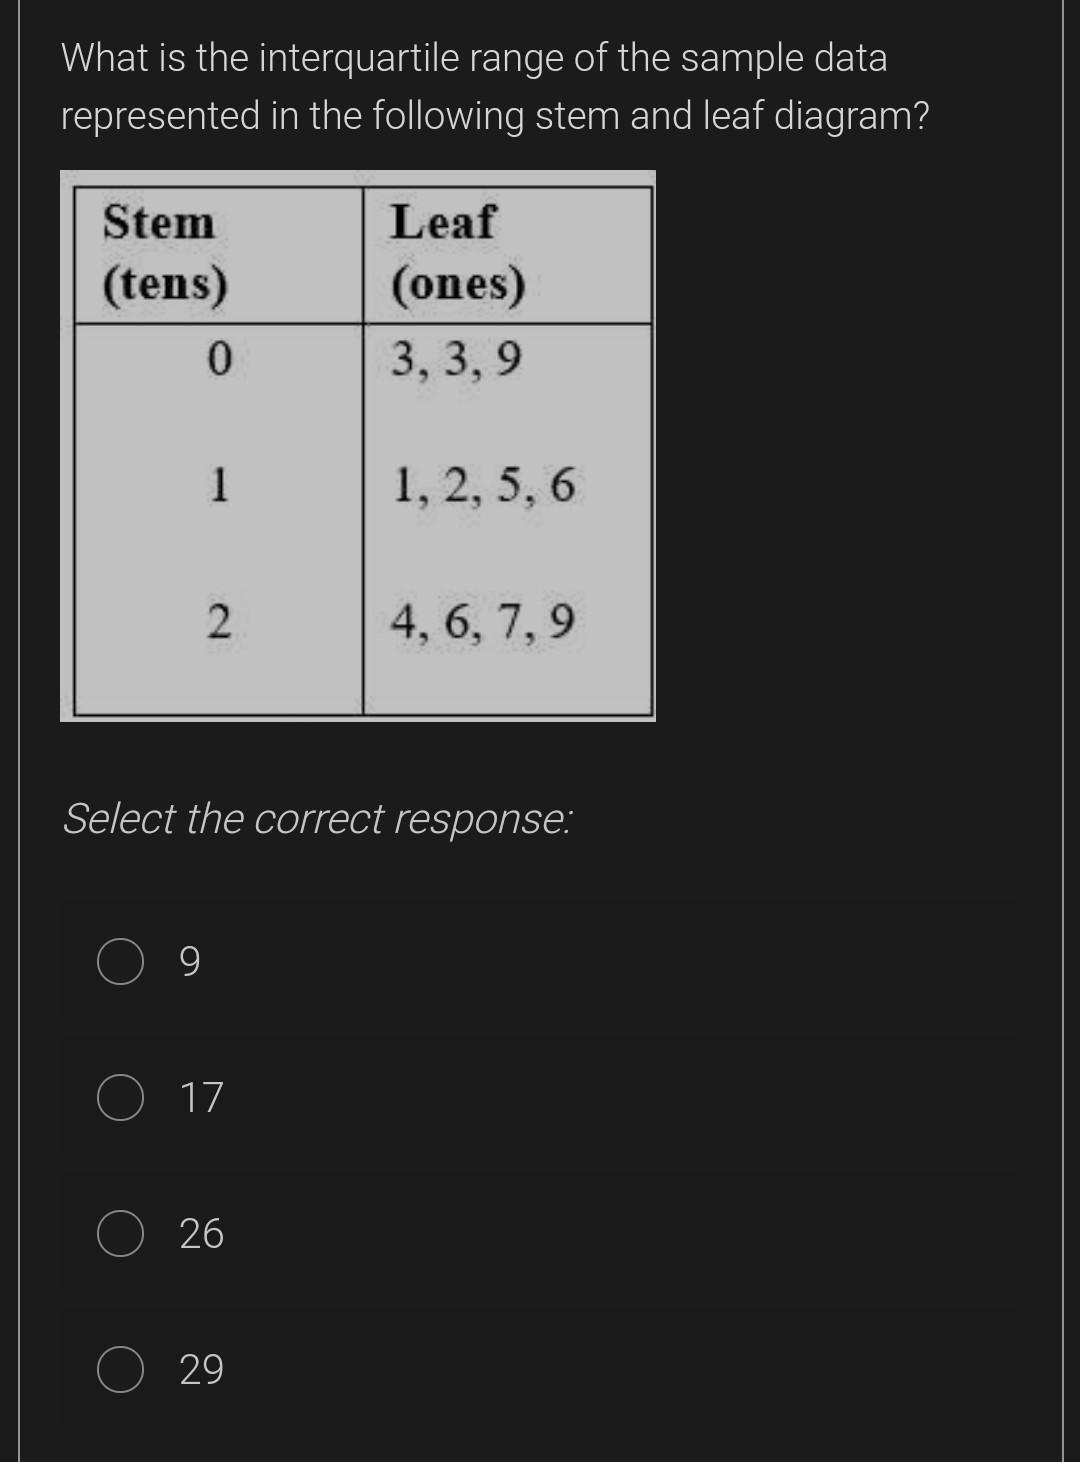
What is the interquartile range of the sample data represented in the following stem and leaf diagram? Stem (tens) Leaf (ones) 0 3,3,9 1 1, 2, 5, 6 2 4,6,7,9 Select the correct response: 17 26 29
Step by Step Solution
There are 3 Steps involved in it
1 Expert Approved Answer
Step: 1 Unlock

Question Has Been Solved by an Expert!
Get step-by-step solutions from verified subject matter experts
Step: 2 Unlock
Step: 3 Unlock