

Question: What is the null and alternative hypothesis? What is the test statistic? What is the p-value? What is the conclusion about the null hypothesis and
What is the null and alternative hypothesis? What is the test statistic? What is the p-value? What is the conclusion about the null hypothesis and the final conclusion that addresses the original claim?
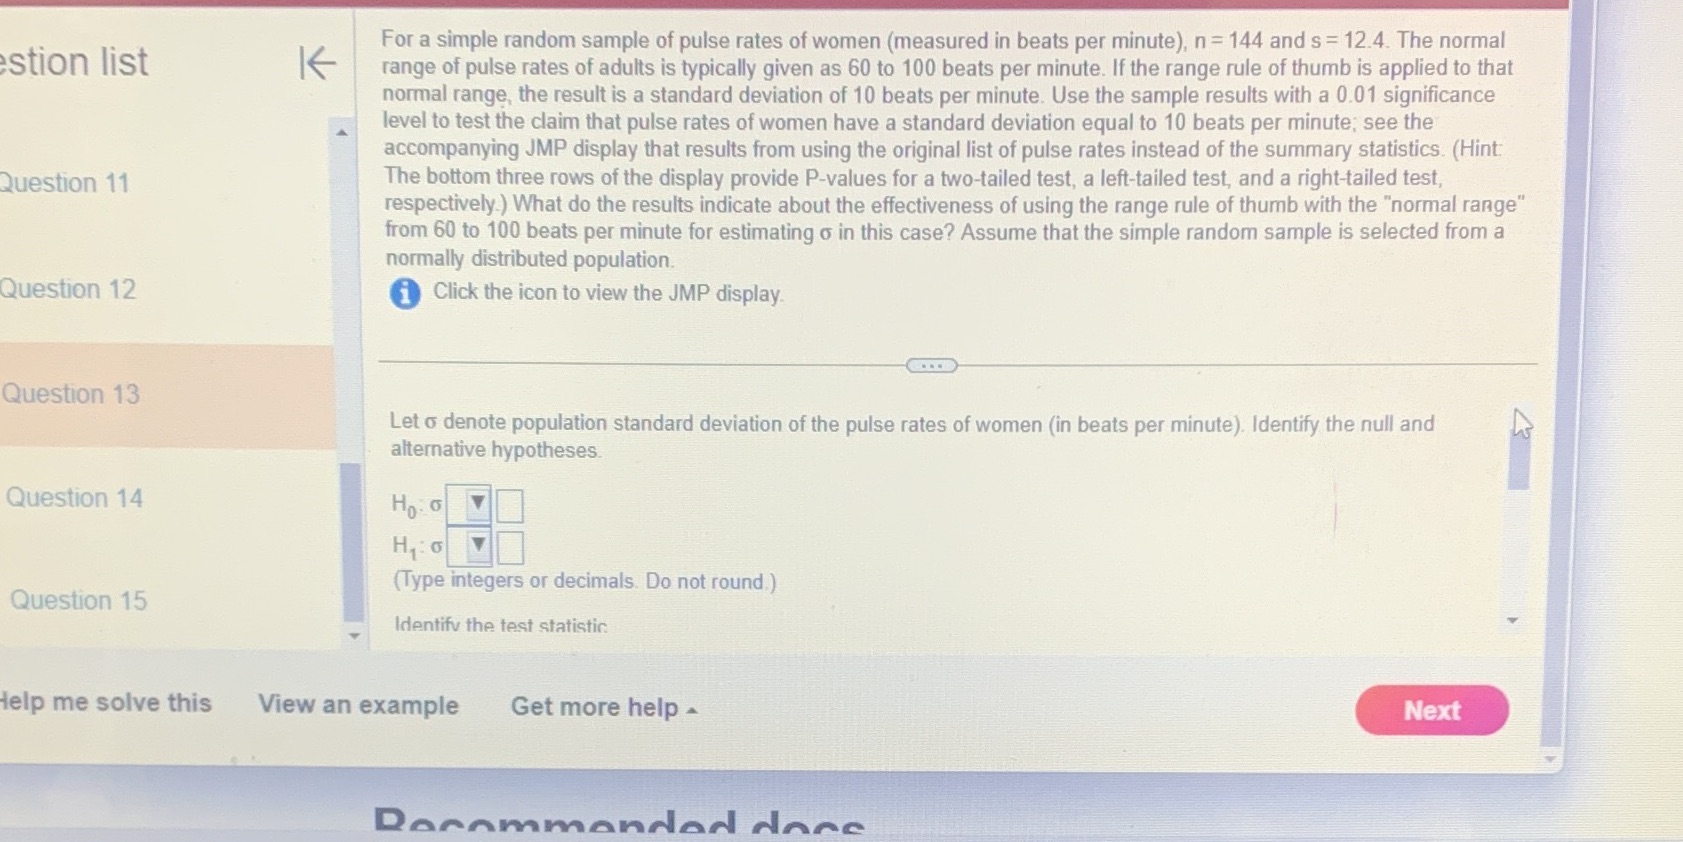
For a simple random sample of pulse rates of women (measured in beats per minute), n = 144 and s = 12.4. The normal stion list K range of pulse rates of adults is typically given as 60 to 100 beats per minute. If the range rule of thumb is applied to that normal range, the result is a standard deviation of 10 beats per minute. Use the sample results with a 0.01 significance level to test the claim that pulse rates of women have a standard deviation equal to 10 beats per minute, see the accompanying JMP display that results from using the original list of pulse rates instead of the summary statistics. (Hint Question 11 The bottom three rows of the display provide P-values for a two-tailed test, a left-tailed test, and a right-tailed test, respectively.) What do the results indicate about the effectiveness of using the range rule of thumb with the "normal range" from 60 to 100 beats per minute for estimating o in this case? Assume that the simple random sample is selected from a normally distributed population. Question 12 i Click the icon to view the JMP display. Question 13 Let o denote population standard deviation of the pulse rates of women (in beats per minute). Identify the null and alternative hypotheses Question 14 H 1 : 6 (Type integers or decimals. Do not round.) Question 15 Identify the test statistic Help me solve this View an example Get more help - Next Docommanded are
Step by Step Solution
There are 3 Steps involved in it

Get step-by-step solutions from verified subject matter experts