Question: What is: The problem, Decision Variables, and Objective Function in this case study? programming, has asked you to help him figure out how to set
What is: The problem, Decision Variables, and Objective Function in this case study?
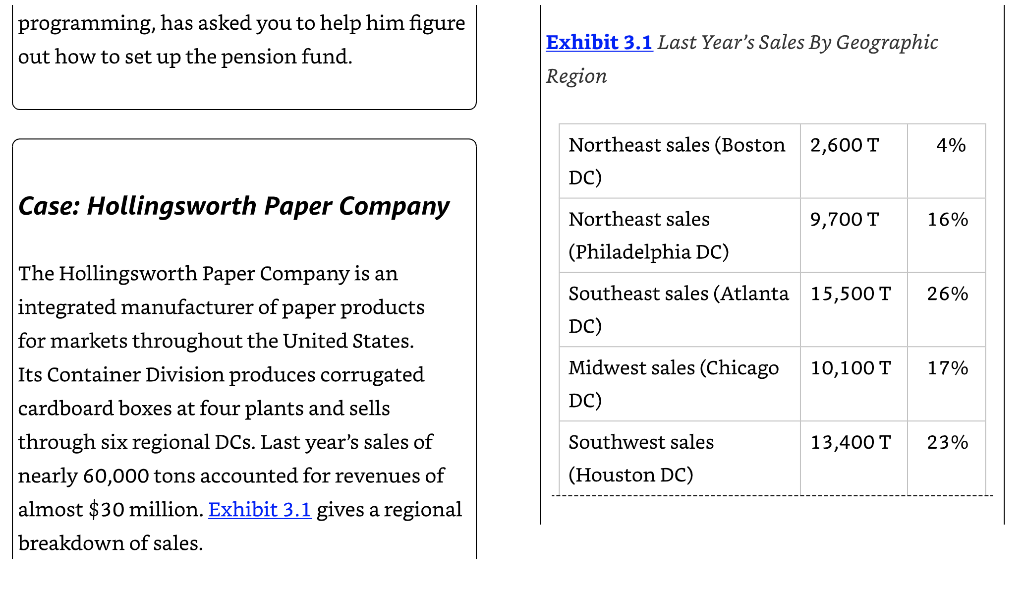
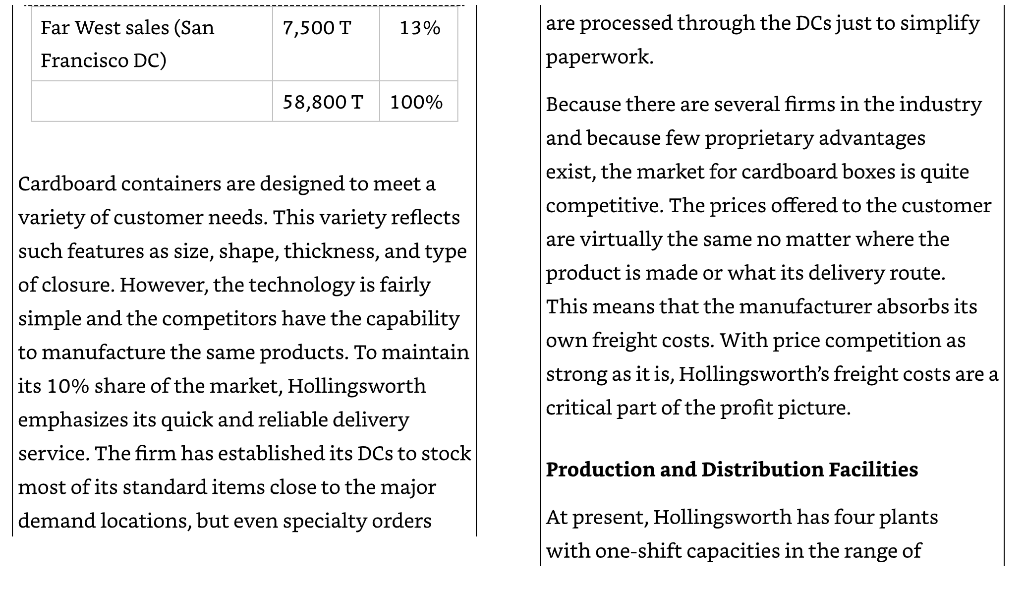
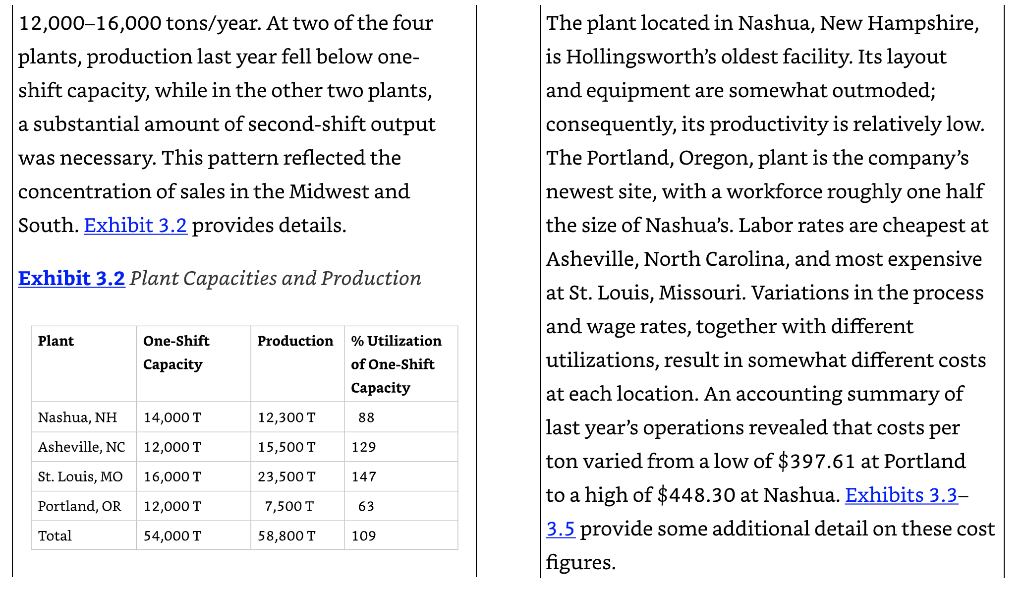
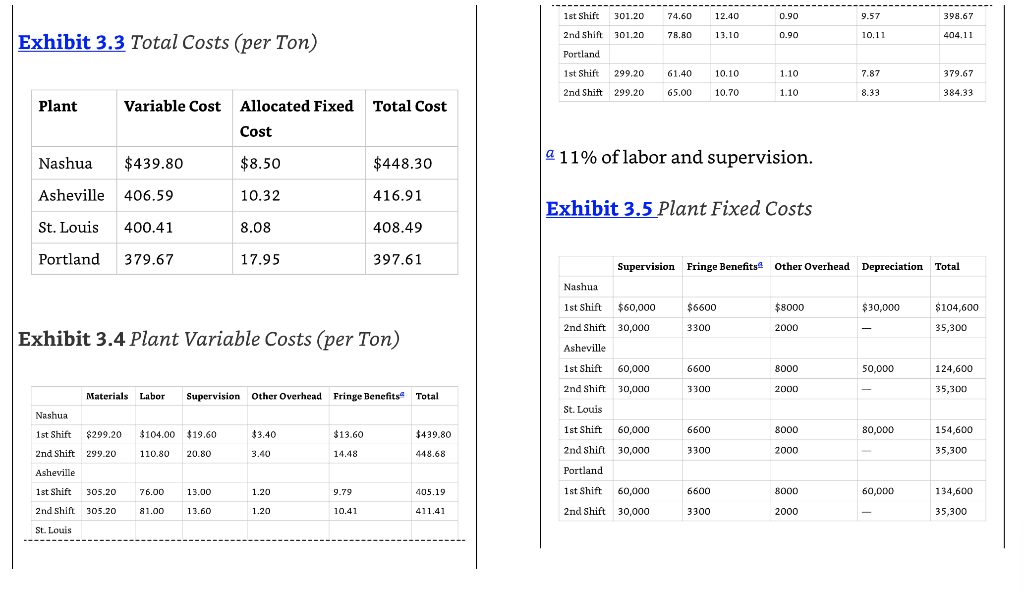
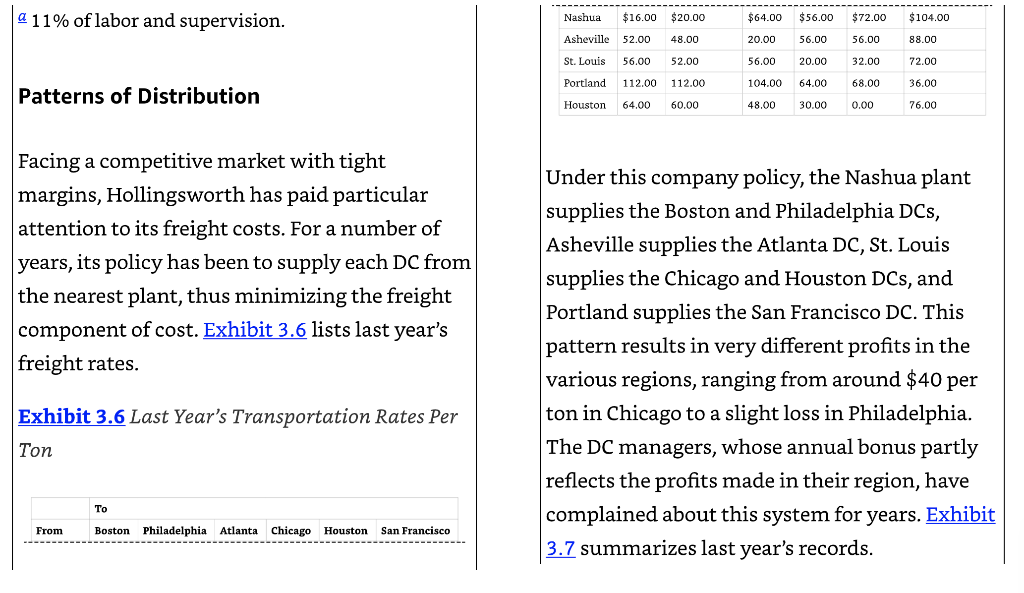
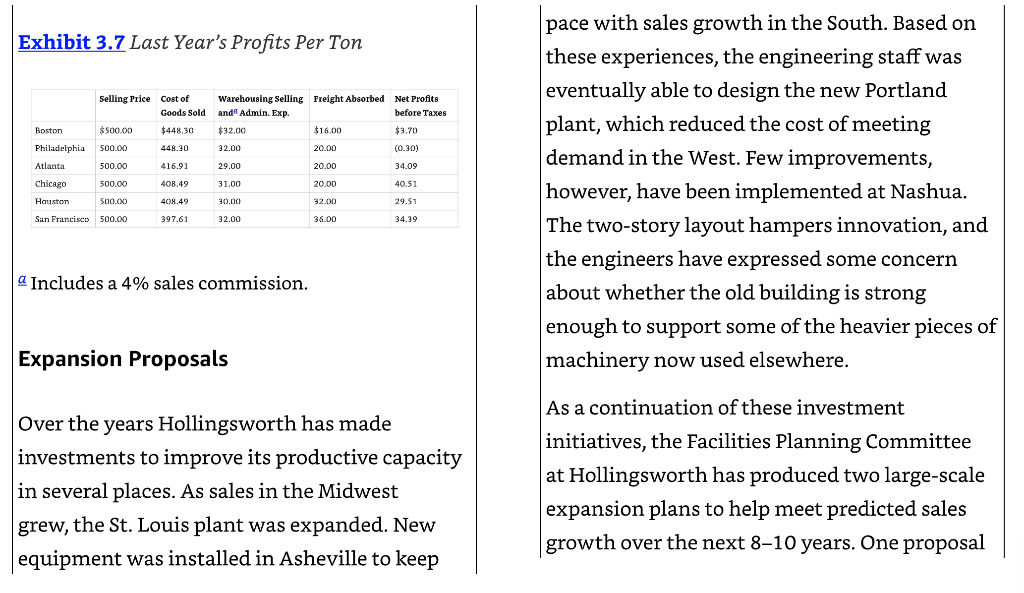
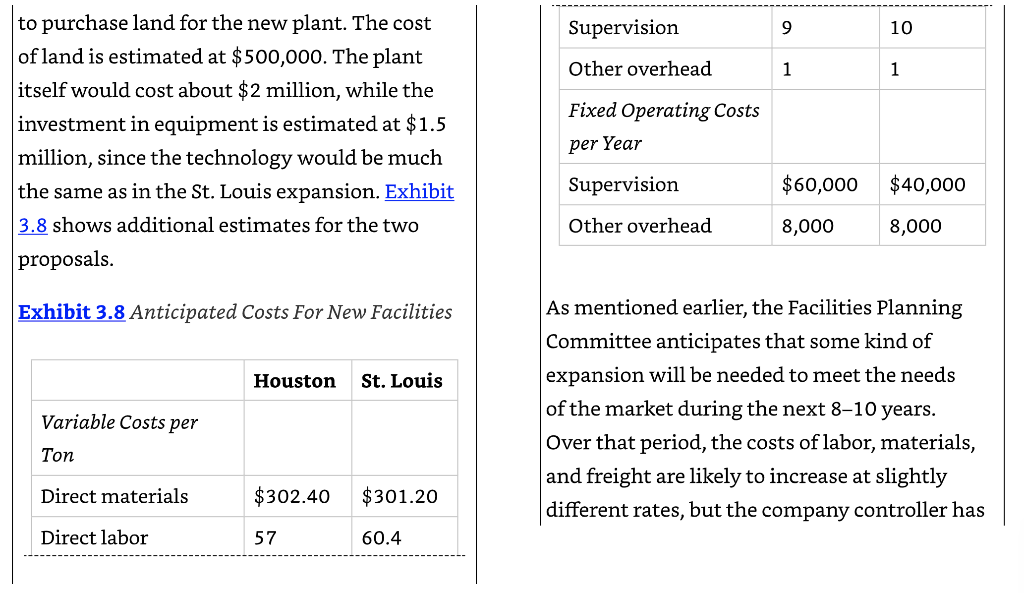
programming, has asked you to help him figure out how to set up the pension fund. Exhibit 3.1 Last Year's Sales By Geographic Region 2,600 T 4% Northeast sales (Boston DC) Case: Hollingsworth Paper Company 9,700 T 16% Northeast sales (Philadelphia DC) 26% Southeast sales (Atlanta 15,500 T DC) 10,100 T 17% The Hollingsworth Paper Company is an integrated manufacturer of paper products for markets throughout the United States. Its Container Division produces corrugated cardboard boxes at four plants and sells through six regional DCs. Last year's sales of nearly 60,000 tons accounted for revenues of almost $30 million. Exhibit 3.1 gives a regional breakdown of sales. Midwest sales (Chicago DC) 13,400 T 23% Southwest sales (Houston DC) 7,500 T 13% Far West sales (San Francisco DC) are processed through the DCs just to simplify paperwork. 58,800 T 100% Cardboard containers are designed to meet a variety of customer needs. This variety reflects such features as size, shape, thickness, and type of closure. However, the technology is fairly simple and the competitors have the capability to manufacture the same products. To maintain its 10% share of the market, Hollingsworth emphasizes its quick and reliable delivery service. The firm has established its DCs to stock most of its standard items close to the major demand locations, but even specialty orders Because there are several firms in the industry and because few proprietary advantages exist, the market for cardboard boxes is quite competitive. The prices offered to the customer are virtually the same no matter where the product is made or what its delivery route. This means that the manufacturer absorbs its own freight costs. With price competition as strong as it is, Hollingsworth's freight costs are a critical part of the profit picture. Production and Distribution Facilities At present, Hollingsworth has four plants with one-shift capacities in the range of 12,000-16,000 tons/year. At two of the four plants, production last year fell below one- shift capacity, while in the other two plants, a substantial amount of second-shift output was necessary. This pattern reflected the concentration of sales in the Midwest and South. Exhibit 3.2 provides details. Exhibit 3.2 Plant Capacities and Production The plant located in Nashua, New Hampshire, is Hollingsworth's oldest facility. Its layout and equipment are somewhat outmoded; consequently, its productivity is relatively low. The Portland, Oregon, plant is the company's newest site, with a workforce roughly one half the size of Nashua's. Labor rates are cheapest at Asheville, North Carolina, and most expensive at St. Louis, Missouri. Variations in the process and wage rates, together with different utilizations, result in somewhat different costs at each location. An accounting summary of last year's operations revealed that costs per ton varied from a low of $397.61 at Portland to a high of $448.30 at Nashua. Exhibits 3.3- 3.5 provide some additional detail on these cost figures. Plant One-Shift Capacity Production % Utilization of One-Shift Capacity Nashua, NH 14,000 T 12,300 T 88 129 Asheville, NC 12,000 T St. Louis, MO 16,000 T 15,500 T 23,500 T 147 Portland, OR 12,000 T 7,500 T 63 Total 54,000 T 58,800 T 109 ------------------------------------------ 1st Shift 301.20 74.60 12.40 0.90 9.57 ------ 398.67 2nd Shift 301.20 78.80 13.10 0.90 10.11 404.11 Exhibit 3.3 Total Costs (per Ton) Portland 61.40 10.10 1.10 7.87 379.67 1st Shift 299.20 2nd Shift 299.20 65.00 10.70 1.10 8.33 384.33 Plant Variable Cost Allocated Fixed Total Cost Cost Nashua $439.80 $8.50 a 11% of labor and supervision. $448.30 Asheville 406.59 10.32 416.91 Exhibit 3.5 Plant Fixed Costs St. Louis 400.41 8.08 408.49 Portland 379.67 17.95 397.61 Supervision Fringe Benefits Other Overhead Depreciation Total Nashua 1st Shift $60,000 $6600 $8000 $30,000 $104,600 3300 2000 35,300 Exhibit 3.4 Plant Variable Costs (per Ton) 2nd Shift 30,000 Asheville 1st Shift 60,000 2nd Shift 30,000 St. Louis 6600 8000 50,000 124,600 3300 2000 35,300 Materials Labor Supervision Other Overhead Fringe Benefits Total Nashua 6600 8000 80,000 1st Shift 154,600 $439.80 $299,20 $104.00 $19.60 $3.40 $13.60 110.80 20.80 3.40 14.48 448.68 1st Shift 60,000 2nd Shin 30,000 Portland 3300 35,300 2000 2nd Shift 299.20 Asheville 1st Shift 305.20 76.00 13.00 1.20 9.79 405.19 1st Shift 60,000 6600 8000 60,000 134,600 2nd Shift 305.20 81.00 13.60 1.20 10.41 411.41 2nd Shift 30,000 3300 2000 35,300 St. Louis a 11% of labor and supervision. Nashua $16.00 $20.00 $64.00 $56.00 $72.00 $104.00 Asheville 52.00 48.00 20.00 56.00 56.00 88.00 St. Louis 56,00 52.00 56,00 20.00 32.00 72.00 Portland 112.00 112.00 104.00 64.00 68.00 36.00 Patterns of Distribution Houston 64.00 60.00 48.00 30.00 0.00 76.00 Facing a competitive market with tight margins, Hollingsworth has paid particular attention to its freight costs. For a number of years, its policy has been to supply each DC from the nearest plant, thus minimizing the freight component of cost. Exhibit 3.6 lists last year's freight rates. Under this company policy, the Nashua plant supplies the Boston and Philadelphia DCS, Asheville supplies the Atlanta DC, St. Louis supplies the Chicago and Houston DCs, and Portland supplies the San Francisco DC. This pattern results in very different profits in the various regions, ranging from around $40 per ton in Chicago to a slight loss in Philadelphia. The DC managers, whose annual bonus partly reflects the profits made in their region, have complained about this system for years. Exhibit 3.7 summarizes last year's records. Exhibit 3.6 Last Year's Transportation Rates Per Ton To From Boston Philadelphia Atlanta Chicago Houston San Francisco Exhibit 3.7 Last Year's Profits Per Ton Selling Price Cost of Warehousing Selling Freight Absorbed Net Profits Goods Sold and Admin. Exp. before Taxes $500.00 $448.30 $32,00 $16.00 $3.70 500.00 448.30 32.00 20.00 (0.30) Boston 500.00 416.91 29.00 20.00 34.09 Philadelphia Atlanta Chicago Houston 500.00 408.49 31.00 20.00 40.51 pace with sales growth in the South. Based on these experiences, the engineering staff was eventually able to design the new Portland plant, which reduced the cost of meeting demand in the West. Few improvements, however, have been implemented at Nashua. The two-story layout hampers innovation, and the engineers have expressed some concern about whether the old building is strong enough to support some of the heavier pieces of machinery now used elsewhere. 500.00) 408,49 30,00 32.00 29.51 San Francisco 500.00 397.61 32.00 36.00 34.39 a Includes a 4% sales commission. Expansion Proposals Over the years Hollingsworth has made investments to improve its productive capacity in several places. As sales in the Midwest grew, the St. Louis plant was expanded. New equipment was installed in Asheville to keep As a continuation of these investment initiatives, the Facilities Planning Committee at Hollingsworth has produced two large-scale expansion plans to help meet predicted sales growth over the next 8-10 years. One proposal while the second proposal involves construction of a new plant in Houston. these experiences, the engineering staff was eventually able to design the new Portland plant, which reduced the cost of meeting demand in the West. Few improvements, however, have been implemented at Nashua. The two-story layout hampers innovation, and the engineers have expressed some concern about whether the old building is strong enough to support some of the heavier pieces of machinery now used elsewhere. The St. Louis proposal calls for an expansion of the existing plant sufficient to raise its annual one-shift capacity to 28,000 tons. The cost for the building for this expansion has been estimated at $1.6 million, and there is adequate land at the St. Louis site. The equipment investment is estimated to be $1.5 million. The plant expansion would afford Hollingsworth an opportunity to use the latest machinery available. As a continuation of these investment initiatives, the Facilities Planning Committee at Hollingsworth has produced two large-scale expansion plans to help meet predicted sales growth over the next 810 years. One proposal involves a large addition to the St. Louis plant, The Houston proposal calls for building a new plant with annual one-shift capacity of 12,000 tons. Although Hollingsworth already has a DC located in Houston, there would be a need Supervision 9 10 Other overhead 1 1 Fixed Operating Costs to purchase land for the new plant. The cost of land is estimated at $500,000. The plant itself would cost about $2 million, while the investment in equipment is estimated at $1.5 million, since the technology would be much the same as in the St. Louis expansion. Exhibit 3.8 shows additional estimates for the two proposals. per Year Supervision $60,000 $40,000 Other overhead 8,000 8,000 Exhibit 3.8 Anticipated Costs For New Facilities Houston St. Louis Variable Costs per As mentioned earlier, the Facilities Planning Committee anticipates that some kind of expansion will be needed to meet the needs of the market during the next 8-10 years. Over that period, the costs of labor, materials, and freight are likely to increase at slightly different rates, but the company controller has Ton Direct materials $302.40 $301.20 Direct labor 57 60.4 commented that the firm's cost structure is not likely to change drastically. programming, has asked you to help him figure out how to set up the pension fund. Exhibit 3.1 Last Year's Sales By Geographic Region 2,600 T 4% Northeast sales (Boston DC) Case: Hollingsworth Paper Company 9,700 T 16% Northeast sales (Philadelphia DC) 26% Southeast sales (Atlanta 15,500 T DC) 10,100 T 17% The Hollingsworth Paper Company is an integrated manufacturer of paper products for markets throughout the United States. Its Container Division produces corrugated cardboard boxes at four plants and sells through six regional DCs. Last year's sales of nearly 60,000 tons accounted for revenues of almost $30 million. Exhibit 3.1 gives a regional breakdown of sales. Midwest sales (Chicago DC) 13,400 T 23% Southwest sales (Houston DC) 7,500 T 13% Far West sales (San Francisco DC) are processed through the DCs just to simplify paperwork. 58,800 T 100% Cardboard containers are designed to meet a variety of customer needs. This variety reflects such features as size, shape, thickness, and type of closure. However, the technology is fairly simple and the competitors have the capability to manufacture the same products. To maintain its 10% share of the market, Hollingsworth emphasizes its quick and reliable delivery service. The firm has established its DCs to stock most of its standard items close to the major demand locations, but even specialty orders Because there are several firms in the industry and because few proprietary advantages exist, the market for cardboard boxes is quite competitive. The prices offered to the customer are virtually the same no matter where the product is made or what its delivery route. This means that the manufacturer absorbs its own freight costs. With price competition as strong as it is, Hollingsworth's freight costs are a critical part of the profit picture. Production and Distribution Facilities At present, Hollingsworth has four plants with one-shift capacities in the range of 12,000-16,000 tons/year. At two of the four plants, production last year fell below one- shift capacity, while in the other two plants, a substantial amount of second-shift output was necessary. This pattern reflected the concentration of sales in the Midwest and South. Exhibit 3.2 provides details. Exhibit 3.2 Plant Capacities and Production The plant located in Nashua, New Hampshire, is Hollingsworth's oldest facility. Its layout and equipment are somewhat outmoded; consequently, its productivity is relatively low. The Portland, Oregon, plant is the company's newest site, with a workforce roughly one half the size of Nashua's. Labor rates are cheapest at Asheville, North Carolina, and most expensive at St. Louis, Missouri. Variations in the process and wage rates, together with different utilizations, result in somewhat different costs at each location. An accounting summary of last year's operations revealed that costs per ton varied from a low of $397.61 at Portland to a high of $448.30 at Nashua. Exhibits 3.3- 3.5 provide some additional detail on these cost figures. Plant One-Shift Capacity Production % Utilization of One-Shift Capacity Nashua, NH 14,000 T 12,300 T 88 129 Asheville, NC 12,000 T St. Louis, MO 16,000 T 15,500 T 23,500 T 147 Portland, OR 12,000 T 7,500 T 63 Total 54,000 T 58,800 T 109 ------------------------------------------ 1st Shift 301.20 74.60 12.40 0.90 9.57 ------ 398.67 2nd Shift 301.20 78.80 13.10 0.90 10.11 404.11 Exhibit 3.3 Total Costs (per Ton) Portland 61.40 10.10 1.10 7.87 379.67 1st Shift 299.20 2nd Shift 299.20 65.00 10.70 1.10 8.33 384.33 Plant Variable Cost Allocated Fixed Total Cost Cost Nashua $439.80 $8.50 a 11% of labor and supervision. $448.30 Asheville 406.59 10.32 416.91 Exhibit 3.5 Plant Fixed Costs St. Louis 400.41 8.08 408.49 Portland 379.67 17.95 397.61 Supervision Fringe Benefits Other Overhead Depreciation Total Nashua 1st Shift $60,000 $6600 $8000 $30,000 $104,600 3300 2000 35,300 Exhibit 3.4 Plant Variable Costs (per Ton) 2nd Shift 30,000 Asheville 1st Shift 60,000 2nd Shift 30,000 St. Louis 6600 8000 50,000 124,600 3300 2000 35,300 Materials Labor Supervision Other Overhead Fringe Benefits Total Nashua 6600 8000 80,000 1st Shift 154,600 $439.80 $299,20 $104.00 $19.60 $3.40 $13.60 110.80 20.80 3.40 14.48 448.68 1st Shift 60,000 2nd Shin 30,000 Portland 3300 35,300 2000 2nd Shift 299.20 Asheville 1st Shift 305.20 76.00 13.00 1.20 9.79 405.19 1st Shift 60,000 6600 8000 60,000 134,600 2nd Shift 305.20 81.00 13.60 1.20 10.41 411.41 2nd Shift 30,000 3300 2000 35,300 St. Louis a 11% of labor and supervision. Nashua $16.00 $20.00 $64.00 $56.00 $72.00 $104.00 Asheville 52.00 48.00 20.00 56.00 56.00 88.00 St. Louis 56,00 52.00 56,00 20.00 32.00 72.00 Portland 112.00 112.00 104.00 64.00 68.00 36.00 Patterns of Distribution Houston 64.00 60.00 48.00 30.00 0.00 76.00 Facing a competitive market with tight margins, Hollingsworth has paid particular attention to its freight costs. For a number of years, its policy has been to supply each DC from the nearest plant, thus minimizing the freight component of cost. Exhibit 3.6 lists last year's freight rates. Under this company policy, the Nashua plant supplies the Boston and Philadelphia DCS, Asheville supplies the Atlanta DC, St. Louis supplies the Chicago and Houston DCs, and Portland supplies the San Francisco DC. This pattern results in very different profits in the various regions, ranging from around $40 per ton in Chicago to a slight loss in Philadelphia. The DC managers, whose annual bonus partly reflects the profits made in their region, have complained about this system for years. Exhibit 3.7 summarizes last year's records. Exhibit 3.6 Last Year's Transportation Rates Per Ton To From Boston Philadelphia Atlanta Chicago Houston San Francisco Exhibit 3.7 Last Year's Profits Per Ton Selling Price Cost of Warehousing Selling Freight Absorbed Net Profits Goods Sold and Admin. Exp. before Taxes $500.00 $448.30 $32,00 $16.00 $3.70 500.00 448.30 32.00 20.00 (0.30) Boston 500.00 416.91 29.00 20.00 34.09 Philadelphia Atlanta Chicago Houston 500.00 408.49 31.00 20.00 40.51 pace with sales growth in the South. Based on these experiences, the engineering staff was eventually able to design the new Portland plant, which reduced the cost of meeting demand in the West. Few improvements, however, have been implemented at Nashua. The two-story layout hampers innovation, and the engineers have expressed some concern about whether the old building is strong enough to support some of the heavier pieces of machinery now used elsewhere. 500.00) 408,49 30,00 32.00 29.51 San Francisco 500.00 397.61 32.00 36.00 34.39 a Includes a 4% sales commission. Expansion Proposals Over the years Hollingsworth has made investments to improve its productive capacity in several places. As sales in the Midwest grew, the St. Louis plant was expanded. New equipment was installed in Asheville to keep As a continuation of these investment initiatives, the Facilities Planning Committee at Hollingsworth has produced two large-scale expansion plans to help meet predicted sales growth over the next 8-10 years. One proposal while the second proposal involves construction of a new plant in Houston. these experiences, the engineering staff was eventually able to design the new Portland plant, which reduced the cost of meeting demand in the West. Few improvements, however, have been implemented at Nashua. The two-story layout hampers innovation, and the engineers have expressed some concern about whether the old building is strong enough to support some of the heavier pieces of machinery now used elsewhere. The St. Louis proposal calls for an expansion of the existing plant sufficient to raise its annual one-shift capacity to 28,000 tons. The cost for the building for this expansion has been estimated at $1.6 million, and there is adequate land at the St. Louis site. The equipment investment is estimated to be $1.5 million. The plant expansion would afford Hollingsworth an opportunity to use the latest machinery available. As a continuation of these investment initiatives, the Facilities Planning Committee at Hollingsworth has produced two large-scale expansion plans to help meet predicted sales growth over the next 810 years. One proposal involves a large addition to the St. Louis plant, The Houston proposal calls for building a new plant with annual one-shift capacity of 12,000 tons. Although Hollingsworth already has a DC located in Houston, there would be a need Supervision 9 10 Other overhead 1 1 Fixed Operating Costs to purchase land for the new plant. The cost of land is estimated at $500,000. The plant itself would cost about $2 million, while the investment in equipment is estimated at $1.5 million, since the technology would be much the same as in the St. Louis expansion. Exhibit 3.8 shows additional estimates for the two proposals. per Year Supervision $60,000 $40,000 Other overhead 8,000 8,000 Exhibit 3.8 Anticipated Costs For New Facilities Houston St. Louis Variable Costs per As mentioned earlier, the Facilities Planning Committee anticipates that some kind of expansion will be needed to meet the needs of the market during the next 8-10 years. Over that period, the costs of labor, materials, and freight are likely to increase at slightly different rates, but the company controller has Ton Direct materials $302.40 $301.20 Direct labor 57 60.4 commented that the firm's cost structure is not likely to change drastically


