

Question: What is the R Studio code that I would put into R Studio for each of these questions? Thank you - Baths: The number of
 What is the R Studio code that I would put into R Studio for each of these questions? Thank you
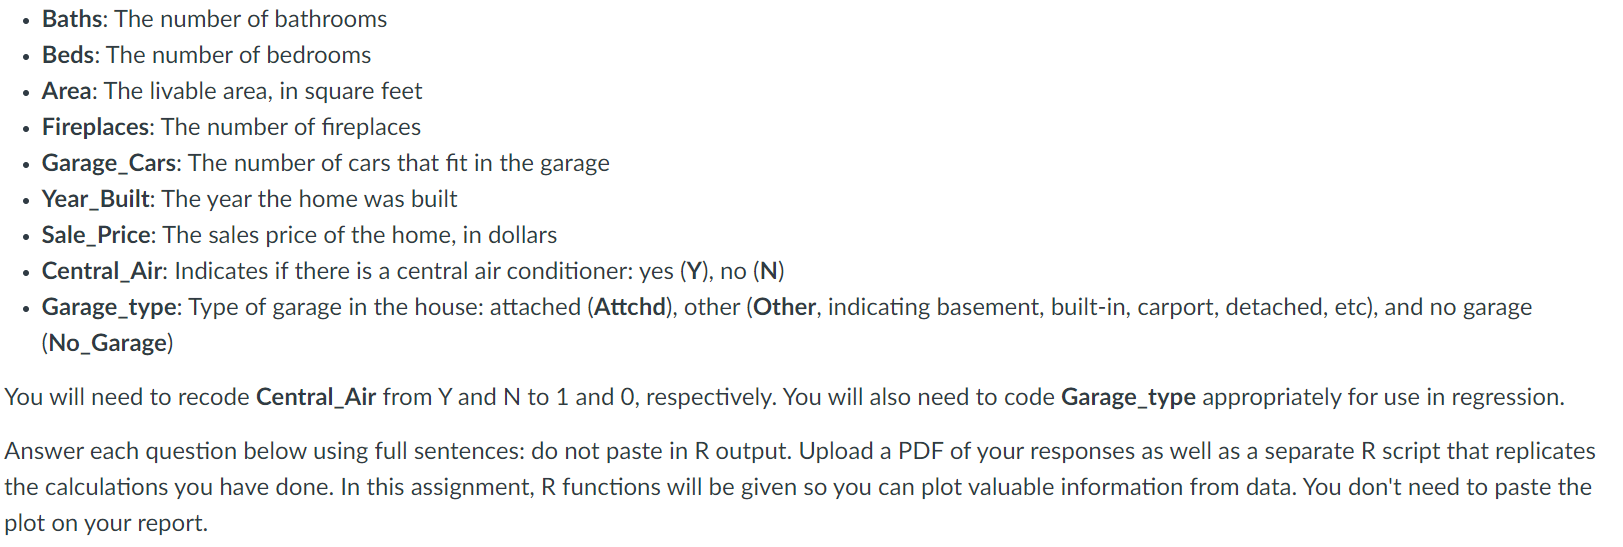
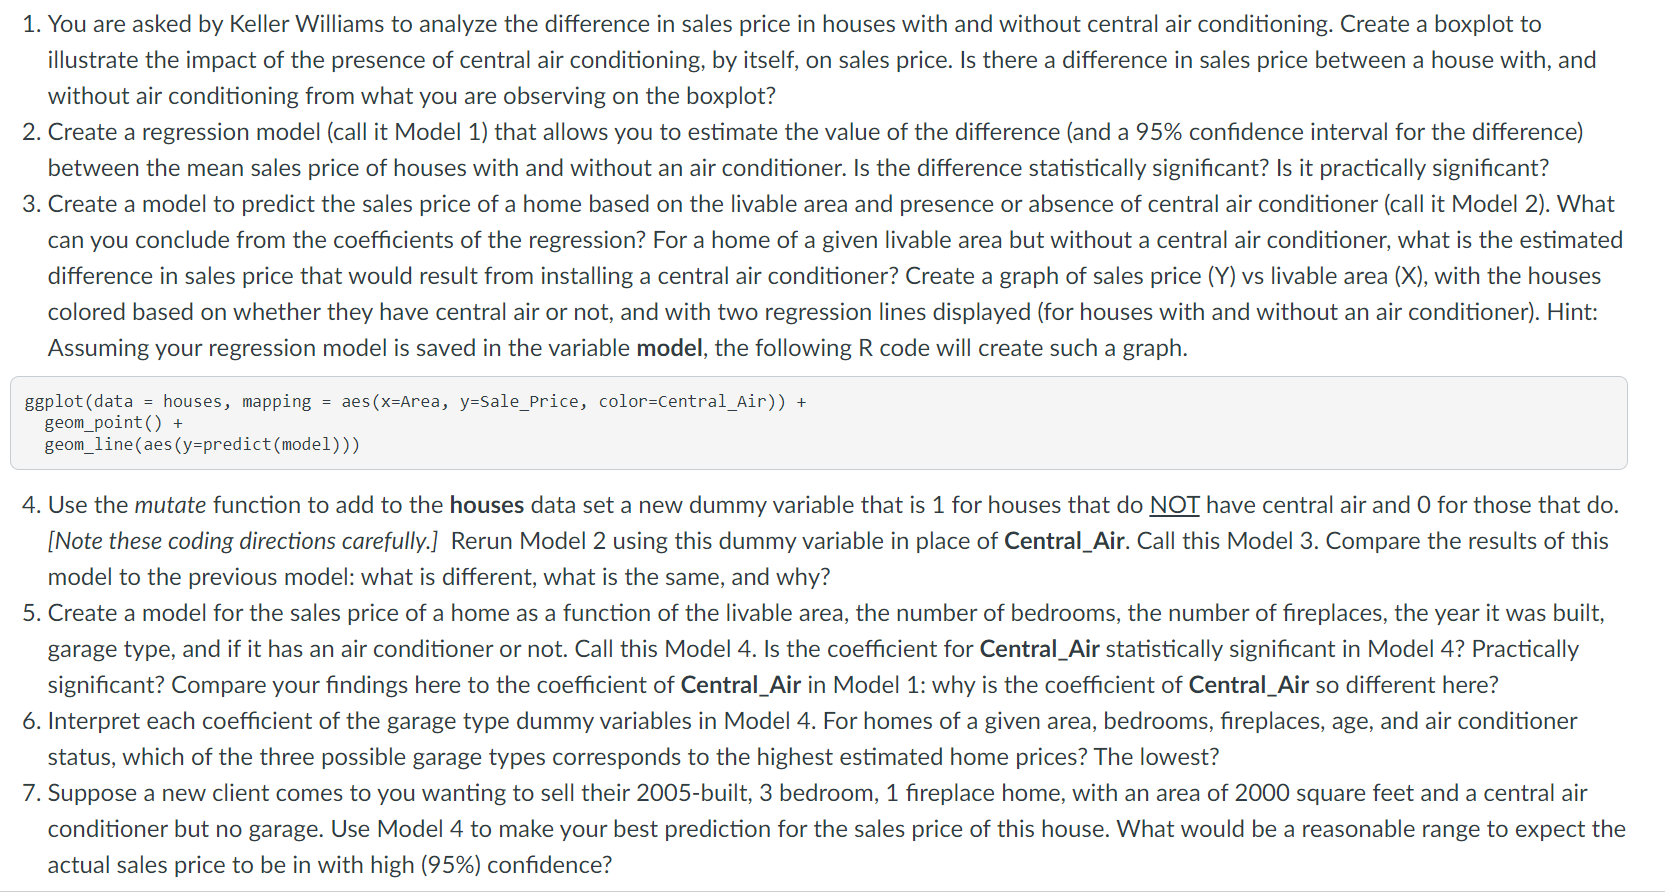
- Baths: The number of bathrooms - Beds: The number of bedrooms - Area: The livable area, in square feet - Fireplaces: The number of fireplaces - Garage_Cars: The number of cars that fit in the garage - Year_Built: The year the home was built - Sale_Price: The sales price of the home, in dollars - Central_Air: Indicates if there is a central air conditioner: yes (Y), no (N) - Garage_type: Type of garage in the house: attached (Attchd), other (Other, indicating basement, built-in, carport, detached, etc), and no garage (No_Garage) You will need to recode Central_Air from Y and N to 1 and 0, respectively. You will also need to code Garage_type appropriately for use in regression. Answer each question below using full sentences: do not paste in R output. Upload a PDF of your responses as well as a separate R script that replicates the calculations you have done. In this assignment, R functions will be given so you can plot valuable information from data. You don't need to paste the plot on your report. 1. You are asked by Keller Williams to analyze the difference in sales price in houses with and without central air conditioning. Create a boxplot to illustrate the impact of the presence of central air conditioning, by itself, on sales price. Is there a difference in sales price between a house with, and without air conditioning from what you are observing on the boxplot? 2. Create a regression model (call it Model 1) that allows you to estimate the value of the difference (and a 95% confidence interval for the difference) between the mean sales price of houses with and without an air conditioner. Is the difference statistically significant? Is it practically significant? 3. Create a model to predict the sales price of a home based on the livable area and presence or absence of central air conditioner (call it Model 2). What can you conclude from the coefficients of the regression? For a home of a given livable area but without a central air conditioner, what is the estimated difference in sales price that would result from installing a central air conditioner? Create a graph of sales price (Y) vs livable area (X), with the houses colored based on whether they have central air or not, and with two regression lines displayed (for houses with and without an air conditioner). Hint: Assuming your regression model is saved in the variable model, the following R code will create such a graph. ggplot ( data = houses, mapping =aes(x= Area, y= Sale_Price, color=Central_Air ))+ geom_point ()+ geom_line ( aes (y= predict (model))) 4. Use the mutate function to add to the houses data set a new dummy variable that is 1 for houses that do NOT have central air and 0 for those that do. [Note these coding directions carefully.] Rerun Model 2 using this dummy variable in place of Central_Air. Call this Model 3. Compare the results of this model to the previous model: what is different, what is the same, and why? 5. Create a model for the sales price of a home as a function of the livable area, the number of bedrooms, the number of fireplaces, the year it was built, garage type, and if it has an air conditioner or not. Call this Model 4. Is the coefficient for Central_Air statistically significant in Model 4? Practically significant? Compare your findings here to the coefficient of Central_Air in Model 1: why is the coefficient of Central_Air so different here? 6. Interpret each coefficient of the garage type dummy variables in Model 4. For homes of a given area, bedrooms, fireplaces, age, and air conditioner status, which of the three possible garage types corresponds to the highest estimated home prices? The lowest? 7. Suppose a new client comes to you wanting to sell their 2005 -built, 3 bedroom, 1 fireplace home, with an area of 2000 square feet and a central air conditioner but no garage. Use Model 4 to make your best prediction for the sales price of this house. What would be a reasonable range to expect the actual sales price to be in with high (95%) confidence
Step by Step Solution
There are 3 Steps involved in it

Get step-by-step solutions from verified subject matter experts