

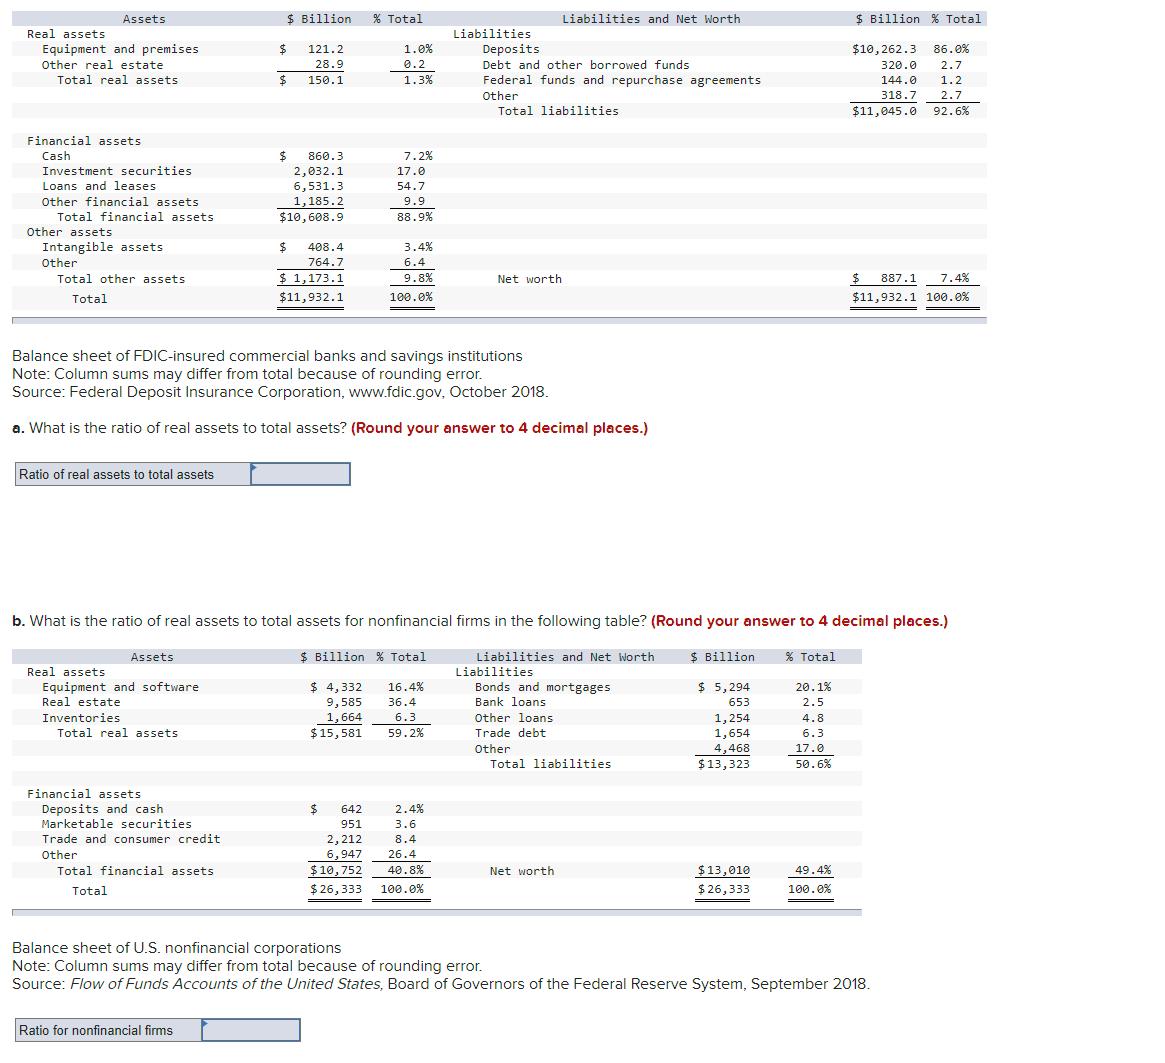
What is the ratio of real assets to total assets? [Round your answer to 4 decimal places]
Fantastic news! We've Found the answer you've been seeking!
Question:
What is the ratio of real assets to total assets? [Round your answer to 4 decimal places] Ratio of real assets to total assets I I b. What is the ratio of real assets to total assets for nonfinancial firms in the following table? [Round your answer to 4 decimal places].
Expert Answer:

Related Book For 

Posted Date:
