

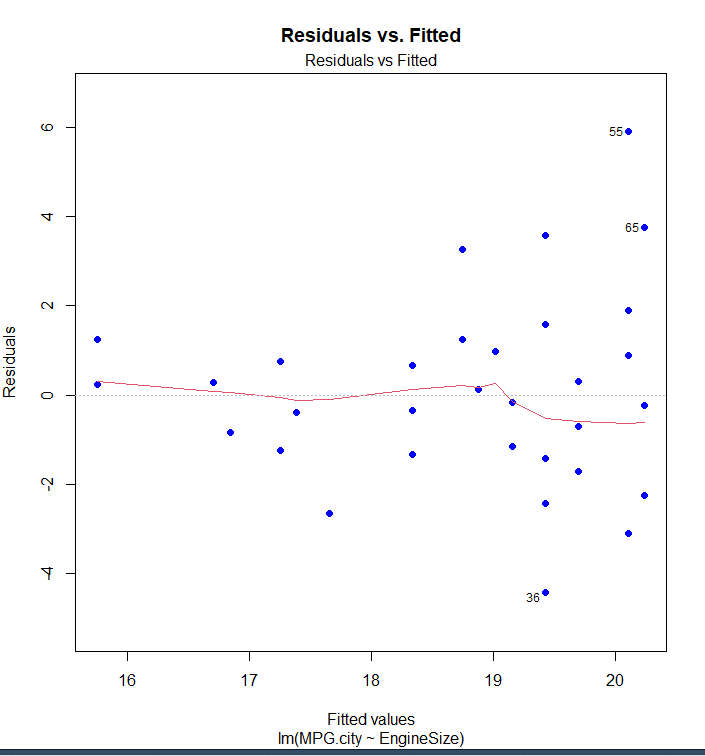
Question: What is the red line on the plot? Residuals vs. Fitted Residuals vs Fitted 55. 650 Residuals . . 36. 16 17 18 19 20
What is the red line on the plot?
Step by Step Solution
There are 3 Steps involved in it
1 Expert Approved Answer
Step: 1 Unlock

Question Has Been Solved by an Expert!
Get step-by-step solutions from verified subject matter experts
Step: 2 Unlock
Step: 3 Unlock