

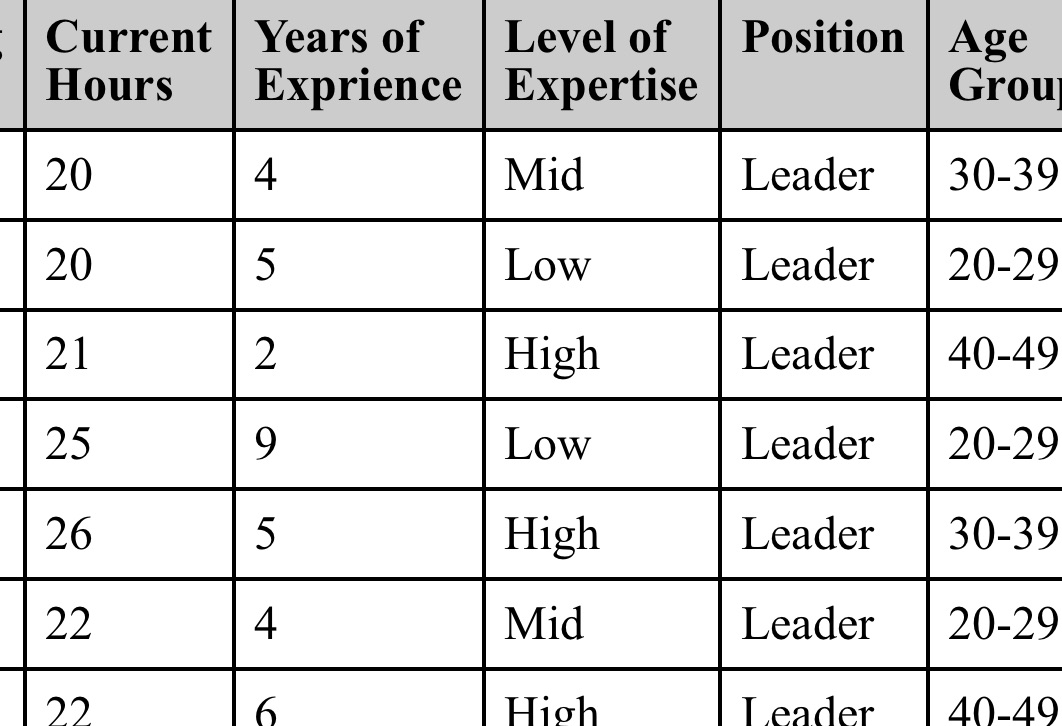
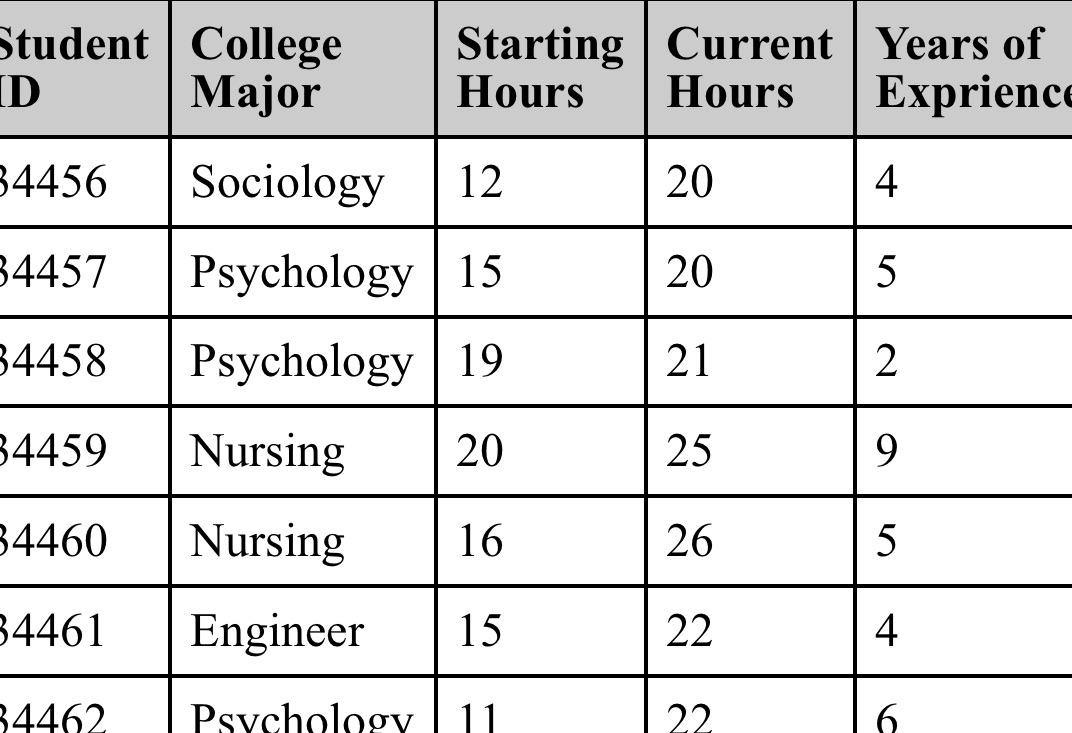
Question: ???What is the sample size for the data set? ???What is the identifier variable in the data set? ???What are the test variables the data
- ???What is the sample size for the data set?
- ???What is the identifier variable in the data set?
- ???What are the test variables the data set? (2 pts)
- ???What are the constants in the data set? (1 pt)
- ???For each variable, determine:
i) Is it a quantitative or qualitative variable?
ii) Is it a continuous or discrete variable?
(2 pts)
111) What is the scale of measurement? (2 pts)
iv) Should a histogram or bar graph be used to represent the frequency? (2 pts)
f) Create a frequency Distribution table for Years of Experience. (2 pts)
Step by Step Solution
There are 3 Steps involved in it
1 Expert Approved Answer
Step: 1 Unlock

Question Has Been Solved by an Expert!
Get step-by-step solutions from verified subject matter experts
Step: 2 Unlock
Step: 3 Unlock