

Question: what is the solution for the mini case chapter 6 finance a focused approach 6th edition calculate the estimated correlation between Bradley and Gourmange rn
what is the solution for the mini case chapter 6 finance a focused approach 6th edition
calculate the estimated correlation between Bradley and Gourmange
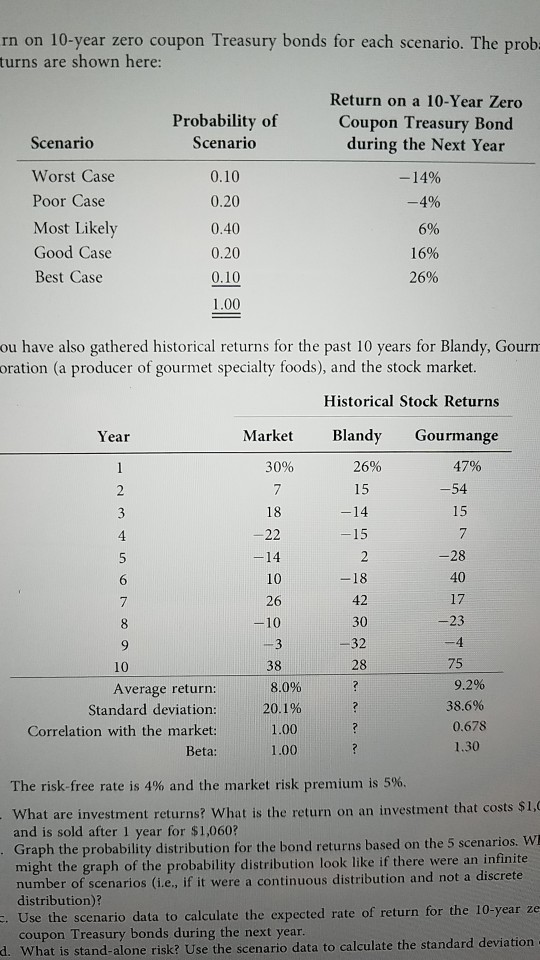
rn on 10-year zero coupon Treasury bonds for each scenario. The prob turns are shown here: Probability of Scenario Return on a 10-Year Zero Coupon Treasury Bond during the Next Year 0.10 0.20 -14% -4% Scenario Worst Case Poor Case Most Likely Good Case Best Case 6% 0.40 0.20 0.10 1.00 16% 26% ou have also gathered historical returns for the past 10 years for Blandy, Gourn oration (a producer of gourmet specialty foods), and the stock market. Historical Stock Returns Year Market Gourmange 30% Blandy 26% 15 47% -54 -14 15 -15 30 -23 -3 38 75 Average return: Standard deviation: Correlation with the market: Beta: 8.0% 20.1% 1.00 1.00 9.2% 38.6% 0.678 1.30 The risk-free rate is 4% and the market risk premium is 5%. What are investment returns? What is the return on an investment that costs $1, and is sold after 1 year for $1,060? Graph the probability distribution for the bond returns based on the 5 scenarios. W might the graph of the probability distribution look like if there were an infinite number of scenarios (ie, if it were a continuous distribution and not a discrete distribution)? Use the scenario data to calculate the expected rate of return for the 10-year ze coupon Treasury bonds during the next year. d. What is stand-alone risk? Use the scenario data to calculate the standard deviation rn on 10-year zero coupon Treasury bonds for each scenario. The prob turns are shown here: Probability of Scenario Return on a 10-Year Zero Coupon Treasury Bond during the Next Year 0.10 0.20 -14% -4% Scenario Worst Case Poor Case Most Likely Good Case Best Case 6% 0.40 0.20 0.10 1.00 16% 26% ou have also gathered historical returns for the past 10 years for Blandy, Gourn oration (a producer of gourmet specialty foods), and the stock market. Historical Stock Returns Year Market Gourmange 30% Blandy 26% 15 47% -54 -14 15 -15 30 -23 -3 38 75 Average return: Standard deviation: Correlation with the market: Beta: 8.0% 20.1% 1.00 1.00 9.2% 38.6% 0.678 1.30 The risk-free rate is 4% and the market risk premium is 5%. What are investment returns? What is the return on an investment that costs $1, and is sold after 1 year for $1,060? Graph the probability distribution for the bond returns based on the 5 scenarios. W might the graph of the probability distribution look like if there were an infinite number of scenarios (ie, if it were a continuous distribution and not a discrete distribution)? Use the scenario data to calculate the expected rate of return for the 10-year ze coupon Treasury bonds during the next year. d. What is stand-alone risk? Use the scenario data to calculate the standard deviation
Step by Step Solution
There are 3 Steps involved in it

Get step-by-step solutions from verified subject matter experts