

Question: what is the solution? Required information Excel Analytics 05-02 (Static) Cost-Volume-Profit Relationships [LO5-1, L05-2, LO5-3, L05-4, LO5-5, L.05-7, .059] tymdia Company is a merchandiser that
![[LO5-1, L05-2, LO5-3, L05-4, LO5-5, L.05-7, .059] tymdia Company is a merchandiser](https://dsd5zvtm8ll6.cloudfront.net/si.experts.images/questions/2024/09/66e883d70e2d6_13466e883d66f303.jpg)
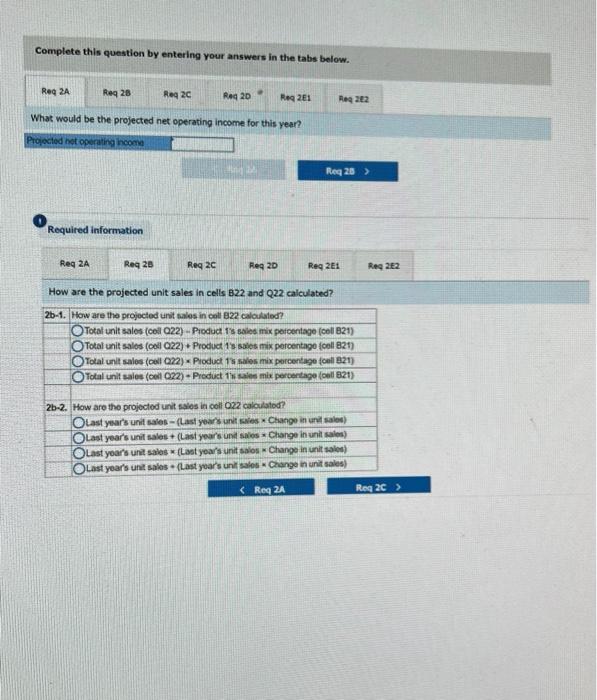
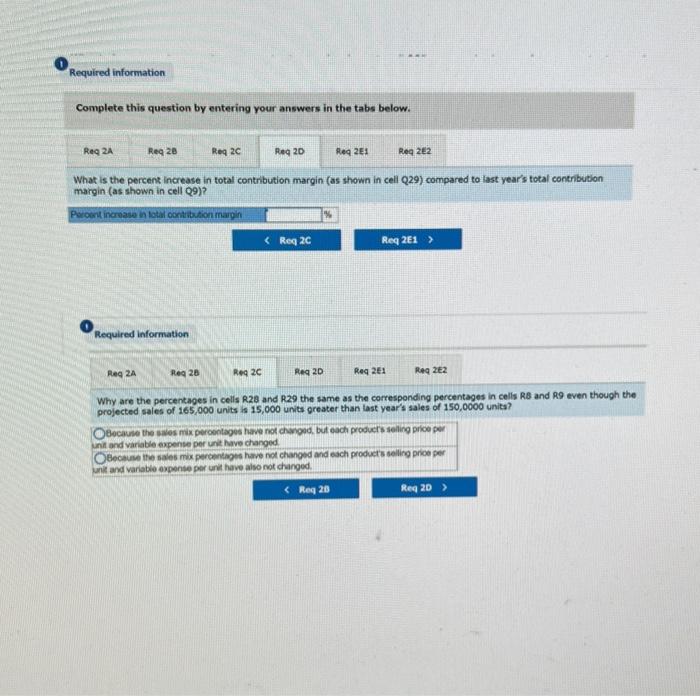
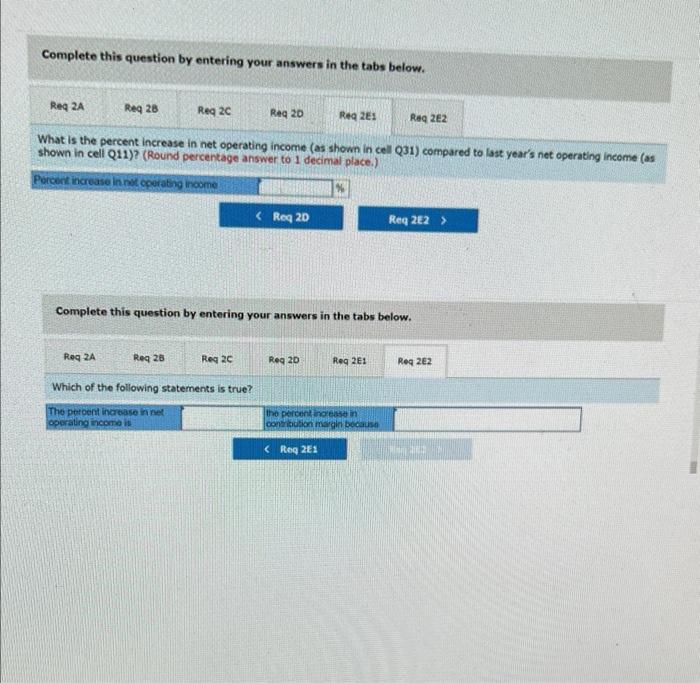
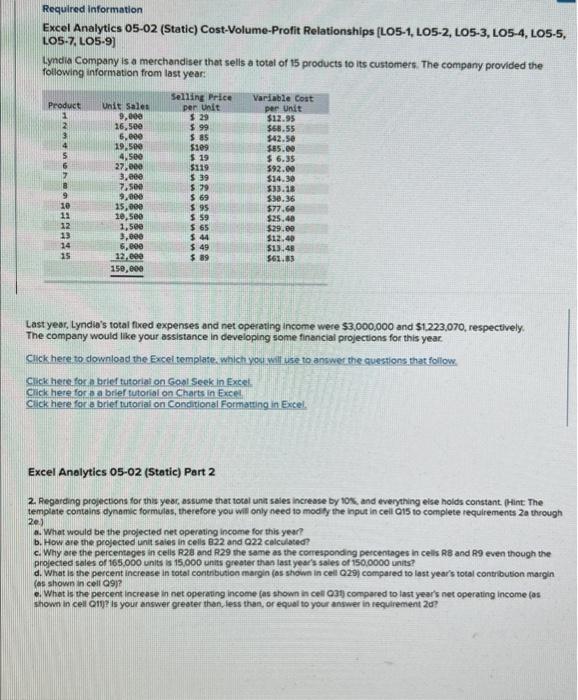
Required information Excel Analytics 05-02 (Static) Cost-Volume-Profit Relationships [LO5-1, L05-2, LO5-3, L05-4, LO5-5, L.05-7, .059] tymdia Company is a merchandiser that sells a total of 15 products to its customers. The company provided the following information from last year: Last yeor, Lyndia's total fixed expenses and net operating income were $3,000,000 and $1.223.070, respectively. The company would like your assistance in developing some financial projections for this year. Click here to download the Excel template. which you will use to answer the questions that follow. Ciek here for a brief tutoriat on Gool Seek in Excel. Cick here for a a brief tutorial on Charts in Excel. Cick here for a brief tutorial on Conditional Formatring in Excel. Excel Analytics 05-02 (Static) Part 2 2. Regarding projections for ths year, assume that totol unit sales increase by 10s, and everything else holds constant. (Hint The template contains dynamic formulas, therefore you wis only need to modiy the input in cell ais to complete requirements za through 20.) a. What would be the projected net operating income for this year? b. How are the projected unit saies in cells 822 and 022 calculated? c. Why are the percemoges in cells R28 and R29 the same as the corresponding peccentages in cells R8 and R9 even though the projectec sales of 165.000 units is 15.000 units greater than last year's sales of 150,0000 units? d. What is the percent increase in total contnbution margin (os shown in cel 029 ) compared to last year's total contrbution margin (os shown in cell Q9? e. What is the percent increase in net operaing income (as shown in cell 03t) compared to last year's net operating income (os: shown in cell ong? is your answer greoter than, less then, or equat to your answer in requirement 20 ? Complete this question by entering your answers in the tabs below. What is the percent increase in total contribution margin (as shown in cell Q29) compared to last year's total contribution margin (as shown in cell Q9)? Why are the percentages in cells R28 and R29 the same as the comesponding percentages in cells R8 and R9 even though the projected sales of 165,000 units is 15,000 units greater than last year's sales of 150,0000 units? 8ecause tha salos mix percentagos have not changed, but each prodicts sciting price por Nhit and variable expense per unit have chanpod. Because the sales mix percentiges have not changed and each products seling price pert Mint and varable expense per unit have also not changed. Complete this question by entering your answers in the tabs below. What would be the projected net operating income for this year? (1) Required information How are the projected unit sales in cells B22. and Q22 calculated? Complete this question by entering your answers in the tabs below. What is the percent increase in total contribution margin (as shown in cell Q29) compared to last year's total contribution margin (as shown in cell Q9)? (1) Required information Why are the percentages in cells R28 and R29 the same as the corresponding percentages in cells Rs and R9 even though the projected sales of 165,000 units is 15,000 units greater than last year's sales of 150,0000 units? Because the eaves mix peroentages have not chanoed, but each products seling price per Mnin and variable expense per unt have changed. Because the saves max percentages have not changed and each products selling proe per Ynis and variable oxpense per unit have also not changed. Complete this question by entering your answers in the tabs below. What is the percent increase in net operating income (as shown in cell Q31) compared to last year's net operating income (as shown in cell Q11)? (Round percentage answer to 1 decimal place.) Complete this question by entering your answers in the tabs below. Which of the following statements is true
Step by Step Solution
There are 3 Steps involved in it

Get step-by-step solutions from verified subject matter experts