

Question: What is the symbol for the sample correlation coefficient? The population correlation coefficient? Complete the statements. The symbol for the sample correlation coefficient is l-(Choose
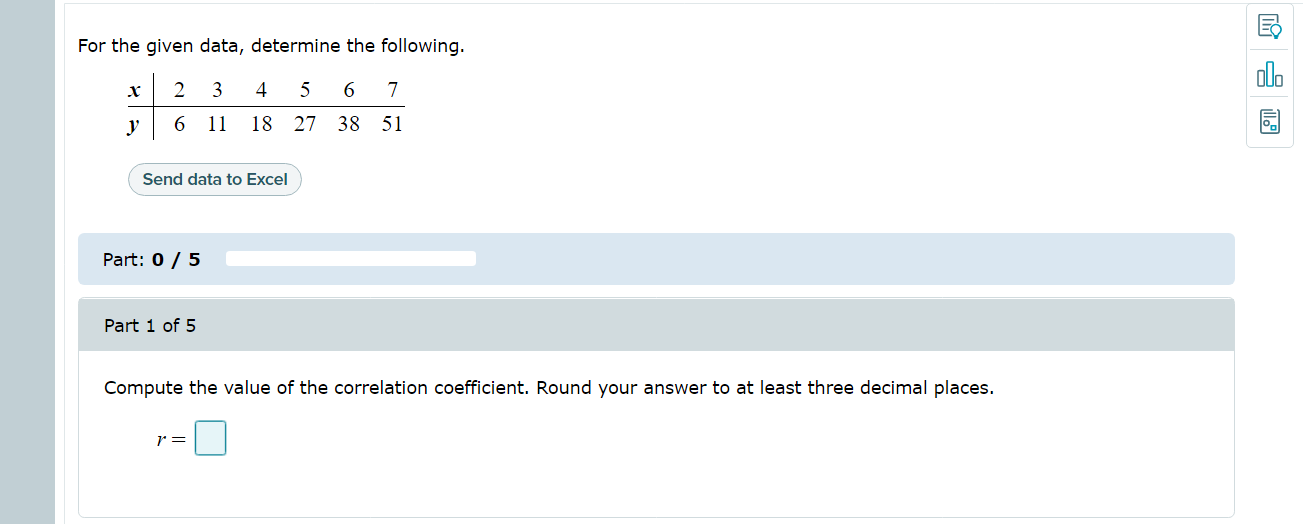
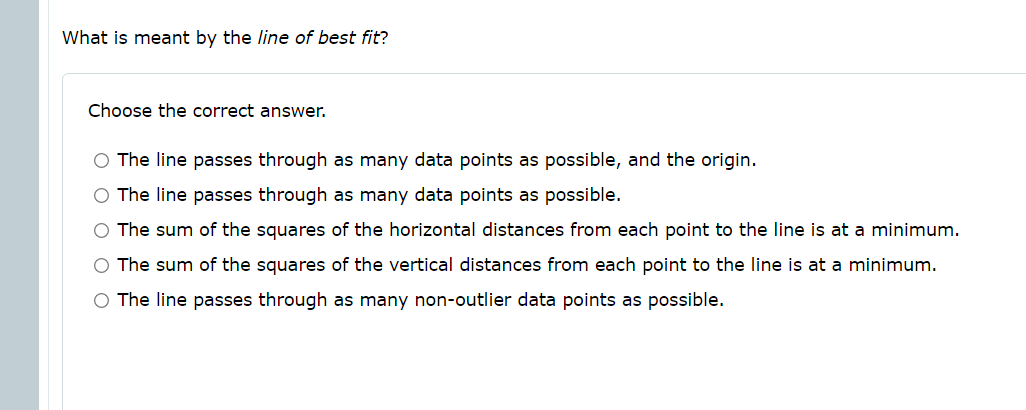

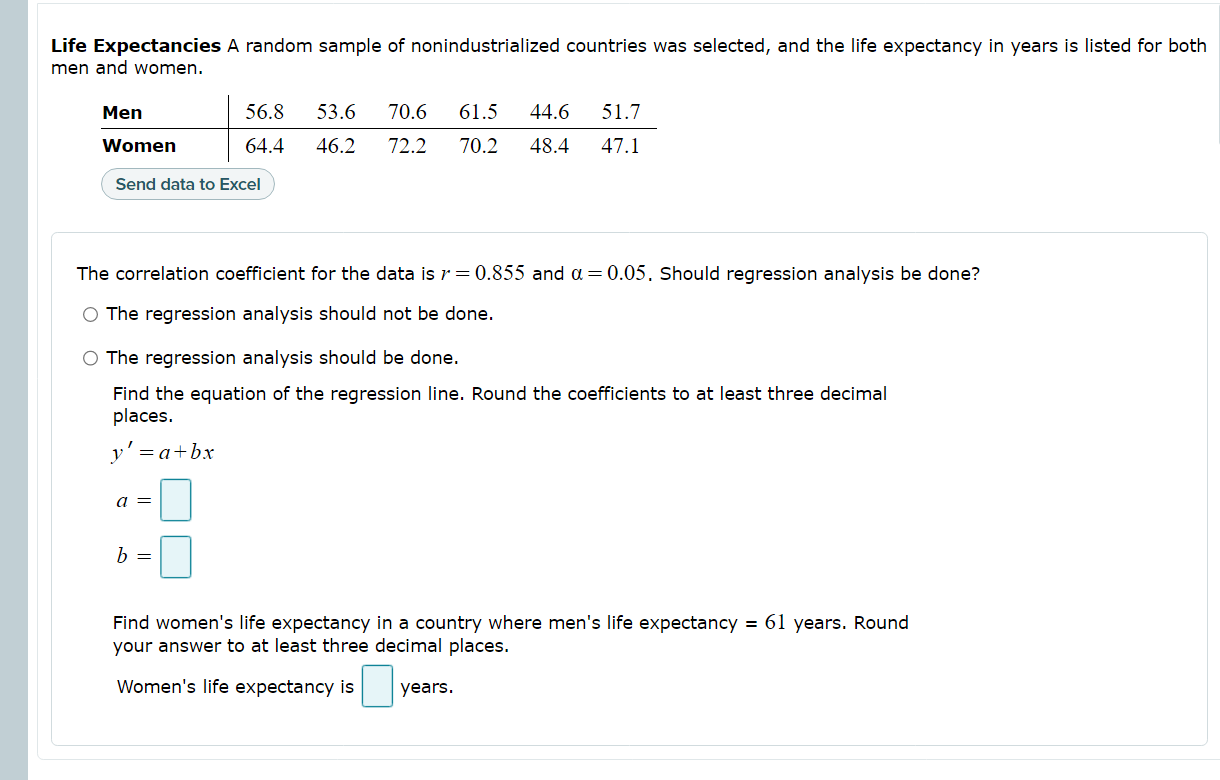
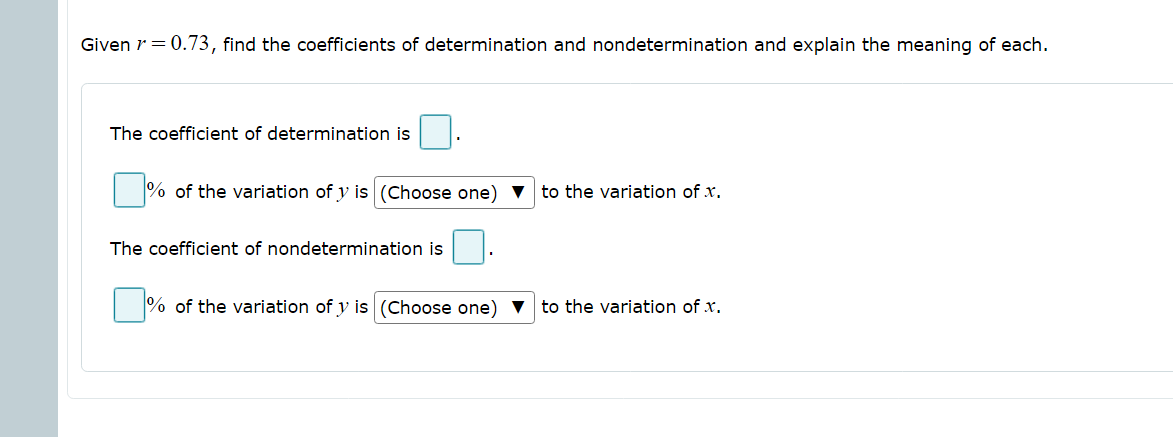

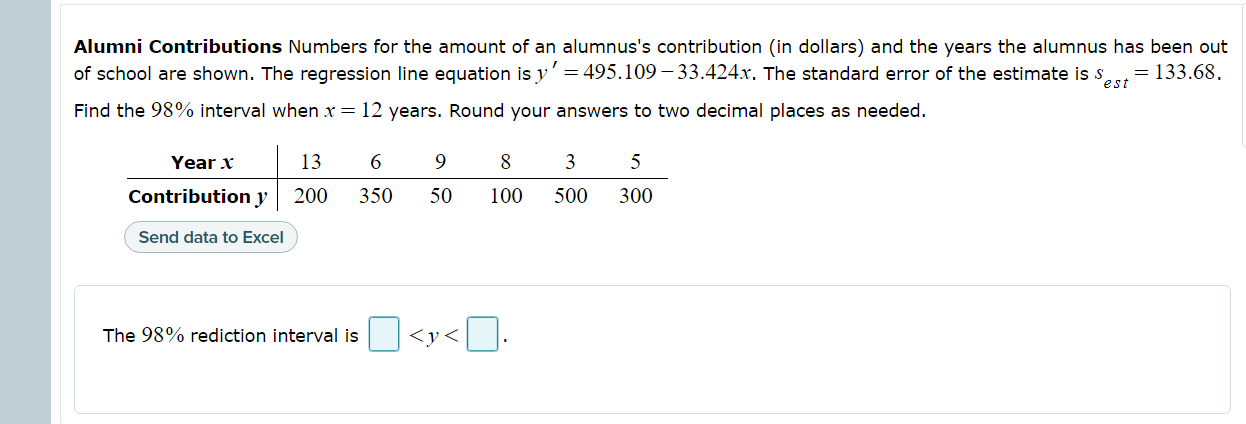


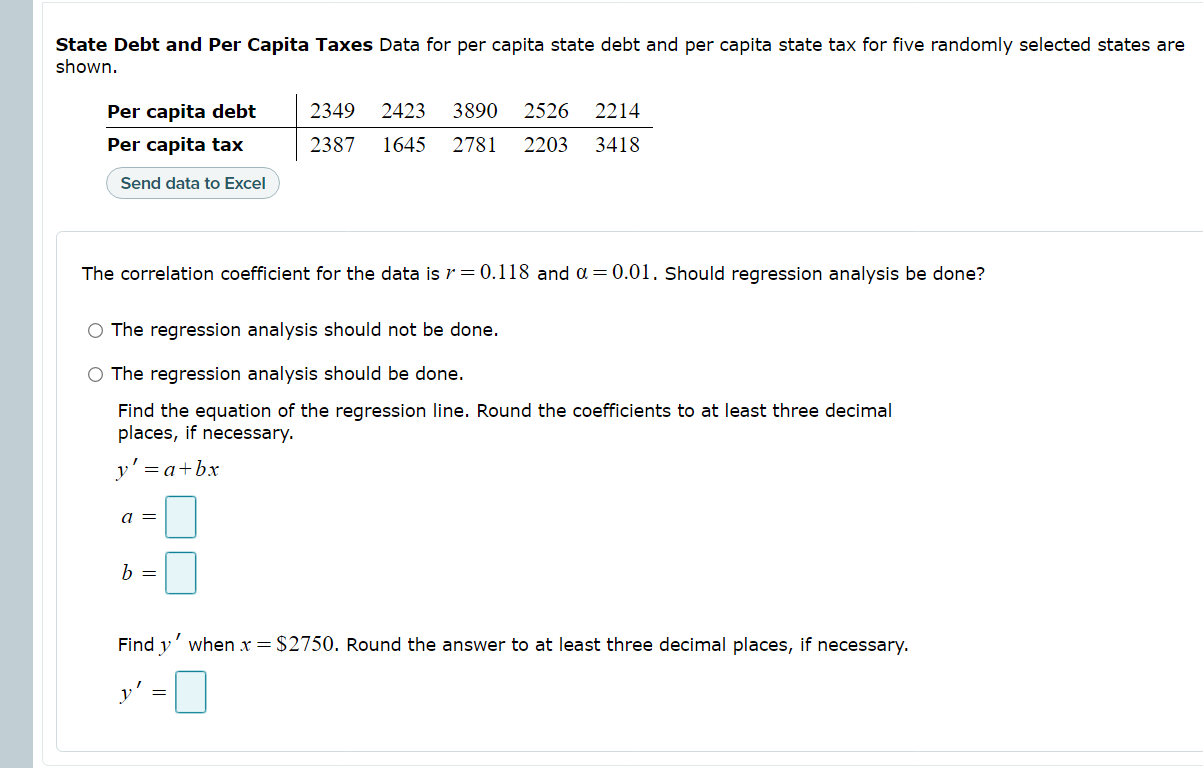


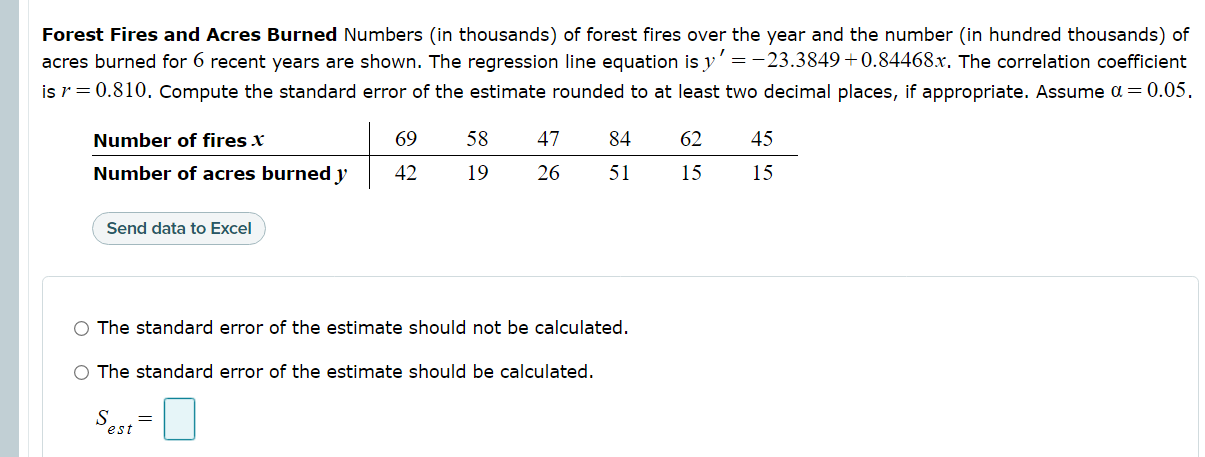

What is the symbol for the sample correlation coefficient? The population correlation coefficient? Complete the statements. The symbol for the sample correlation coefficient is l-(Choose one) V l. The symbol for the population correlation coefficient is l(Choose one) 7 l. For the given data, determine the following. y 6 ll 18 27 38 51 Send data to Excel Part: 0/5 PartiofS Compute the value of the correlation coefficient. Round your answer to at least three decimal places. What is meant by the line of best t? Choose the correct answer. {I} The line passes through as many data points as possible, and the origin. {:3- The line passes through as many data points as possible. (:3- The sum of the squares of the horizontal distances from each point to the line is at a minimum. (:3- The sum of the squares of the vertical distances from each point to the line is at a minimum. (:3- The line passes through as many non-outlier data points as possible. State Debt and Per Capita Taxes Data for per capita state debt and per capita state tax for five randomly selected states are shown. 3349 2433 3890 3526 3214 3387 1645 3781 3303 3418 Per capita debt Per capita tax Send data to Excel The correlation coefficient for the data is r : 0.118 and a : 0.01. Should regression analysis be done? (I) The regression analysis should not be done. {I} The regression analysis should be done. Find the equation of the regression line. Round the coefficients to at least three decimal places, if necessary. _1-' l 2 (1+ bx a:l Life Expectancies A random sample of nonindustrialized countries was selected, and the life expectancy in years is listed for both men and women. Men l56.8 53.6 70.6 61.5 44.6 51.7 Women l64.4 46.2 73.2 70.2 48.4 47.1 Send data to Excel The correlation coefficient For the data is r = 0.855 and u = 0.05. Should regression analysis be done? {I} The regression analysis should not be done. 0 The regression analysis should be done. Find the equation of the regression line. Round the coefficients to at least three decimal places. 31-" = a+bx a = l b : l Find women's life expectancy in a country where men's life expectancy = 61 years. Round your answer to at least three decimal places. Women's life expectancy is l l years. Given 7 = 0.73, find the coefficients of determination and nondetermination and explain the meaning of each. The coefficient of determination is % of the variation of y is (Choose one) to the variation of x. The coefficient of nondetermination is % of the variation of 1 is (Choose one) V to the variation of x.Forest Fires and Acres Burned Numbers (in thousands) of forest fires over the year and the number (in hundred thousands) of acres burned for 6 recent years are shown. The regression line equation is y' = -23.3849 +0.84468x. The correlation coefficient is / = 0.810. Compute the standard error of the estimate rounded to at least two decimal places, if appropriate. Assume d = 0.05. Number of fires X 69 58 47 84 62 45 Number of acres burned y 42 19 26 51 15 15 Send data to Excel O The standard error of the estimate should not be calculated. O The standard error of the estimate should be calculated. S estAlumni Contributions Numbers for the amount of an alumnus's contribution (in dollars) and the years the alumnus has been out of school are shown. The regression line equation is y '= 495.109-33.424x. The standard error of the estimate is S = 133.68. Find the 98% interval when x = 12 years. Round your answers to two decimal places as needed. Year X 13 6 9 8 3 5 Contribution y 200 350 50 100 500 300 Send data to Excel The 98% rediction interval is
Step by Step Solution
There are 3 Steps involved in it

Get step-by-step solutions from verified subject matter experts