

Question: What is the test statistic? What is the P-Value? Does the size of the car appear to have an effect on the force on the
What is the test statistic? What is the P-Value? Does the size of the car appear to have an effect on the force on the left femur in crash tests?
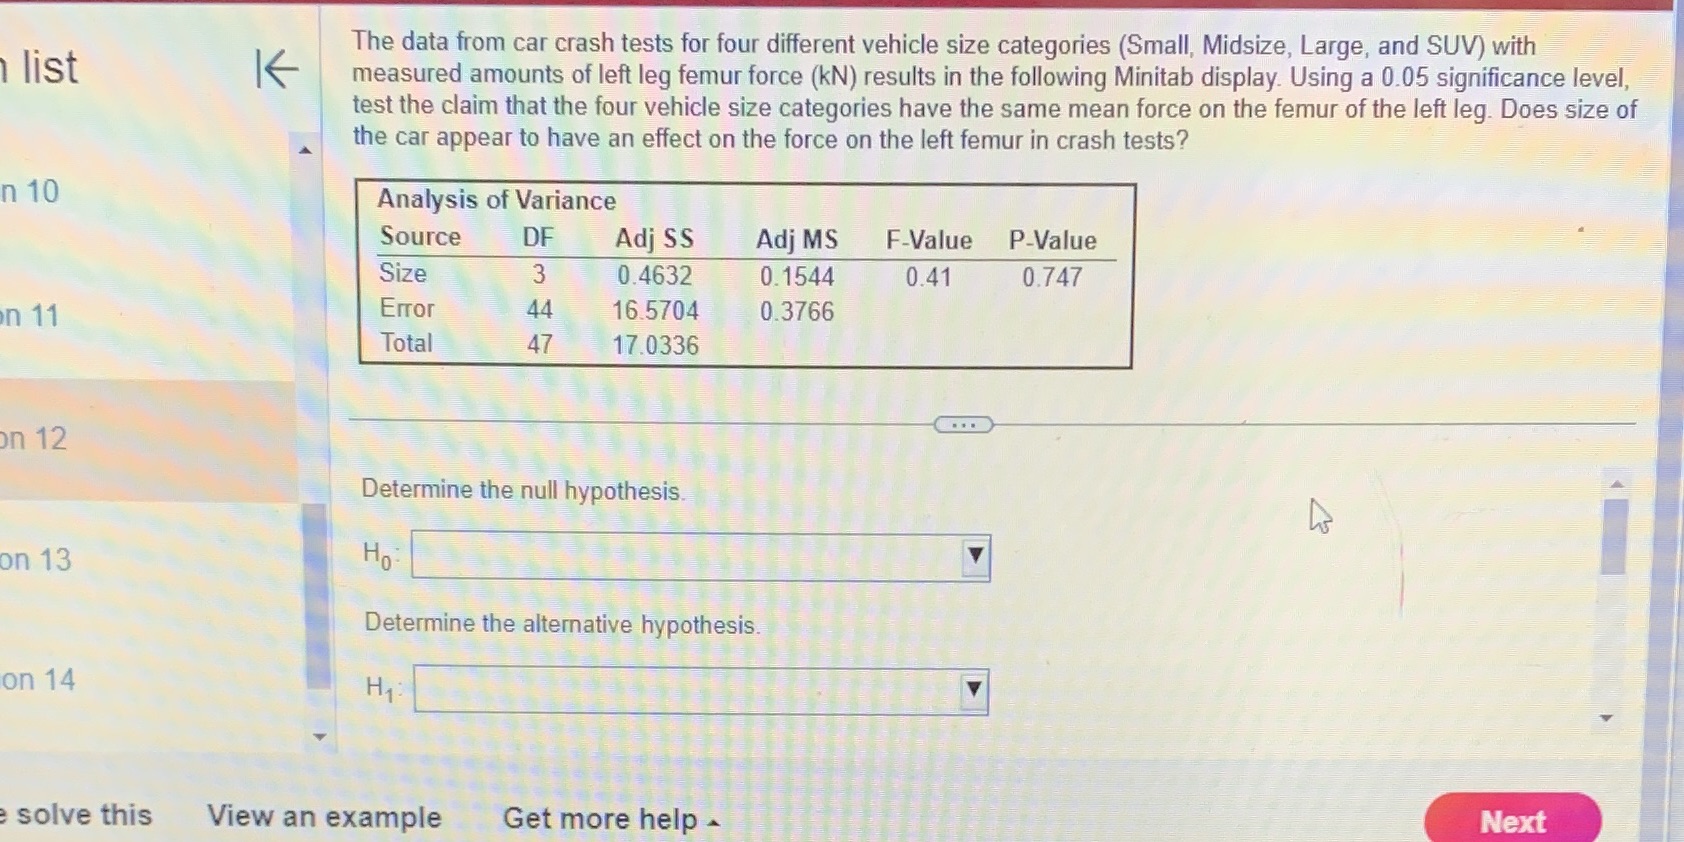
The data from car crash tests for four different vehicle size categories (Small, Midsize, Large, and SUV) with list K measured amounts of left leg femur force (kN) results in the following Minitab display. Using a 0.05 significance level, test the claim that the four vehicle size categories have the same mean force on the femur of the left leg. Does size of the car appear to have an effect on the force on the left femur in crash tests? n 10 Analysis of Variance Source DF Adj SS Adj MS F-Value P-Value Size 3 0.4632 0. 1544 0.41 0.747 in 11 Error 44 16.5704 0.3766 Total 47 17.0336 . . . on 12 Determine the null hypothesis. on 13 Ho Determine the alternative hypothesis. on 14 H1: solve this View an example Get more help - Next
Step by Step Solution
There are 3 Steps involved in it

Get step-by-step solutions from verified subject matter experts