

Question: What is the upper control limit for the process control chart? If you are using an x-bar and r-chart enter the upper control limit for
 What is the upper control limit for the process control chart? If you are using an x-bar and r-chart enter the upper control limit for the x-bar chart here. If you are using a p-chart or a c-chart enter the upper control limit here.
What is the lower control limit for the process control chart? If you are using an x-bar and r-chart enter the lower control limit for the x-bar chart here. If you are using a p-chart or a c-chart enter the lower control limit here.
What is the upper control limit for the second process control chart? If you are using an x-bar and r-chart enter the upper control limit for the r-chart here. If you are using a p-chart or a c-chart enter 100
What is the lower control limit for the second process control chart? If you are using an x-bar and r-chart enter the lower control limit for the r-chart here. If you are using a p-chart or a c-chart enter 100.
Is the original process in control?
Walt makes 5 widgets with the new steel (taking a new sample). They weigh 502, 518, 499, 521 and 519. Do the new ingredients produce widgets that are within the acceptable control limits of the chart you developed?
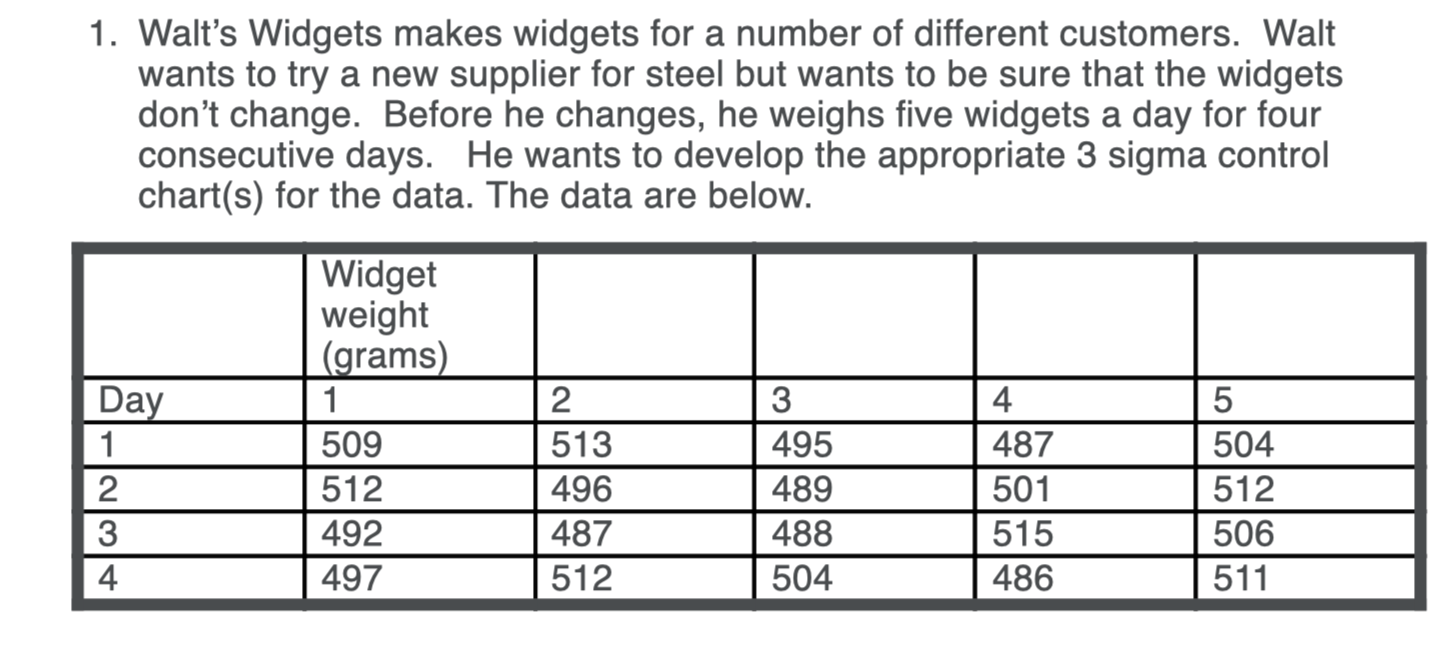
1. Walt's Widgets makes widgets for a number of different customers. Walt wants to try a new supplier for steel but wants to be sure that the widgets don't change. Before he changes, he weighs five widgets a day for four consecutive days. He wants to develop the appropriate 3 sigma control chart(s) for the data. The data are below. Day 1 Widget weight (grams) 1 509 512 492 497 AWN 2 513 496 487 512 3 495 489 488 504 4 487 501 515 486 5 504 512 506 511
Step by Step Solution
There are 3 Steps involved in it

Get step-by-step solutions from verified subject matter experts