

Question: what is the upper control limit gor C chart using +- 3 sigma a. 0.0200 b. 0.0500 c. 40.0000 d. 28.0000 e. 15.0000 given the
what is the upper control limit gor C chart using +- 3 sigma 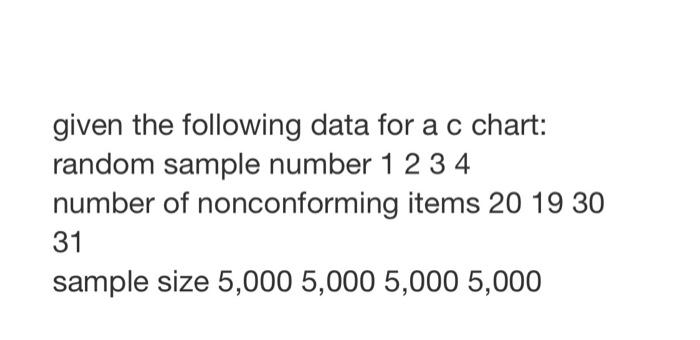
given the following data for a c chart: random sample number 1234 number of nonconforming items 201930 31 sample size 5,000 5,000 5,000 5,000
a. 0.0200
b. 0.0500
c. 40.0000
d. 28.0000
e. 15.0000
Step by Step Solution
There are 3 Steps involved in it
1 Expert Approved Answer
Step: 1 Unlock

Question Has Been Solved by an Expert!
Get step-by-step solutions from verified subject matter experts
Step: 2 Unlock
Step: 3 Unlock